. 2010 Oct;137(20):3361-72.
doi: 10.1242/dev.050864. Epub 2010 Sep 8.

A role for PDGF signaling in expansion of the extra-embryonic endoderm lineage of the mouse blastocyst

Affiliations

A role for PDGF signaling in expansion of the extra-embryonic endoderm lineage of the mouse blastocyst

Jérôme Artus et al. Development. 2010 Oct.

Abstract

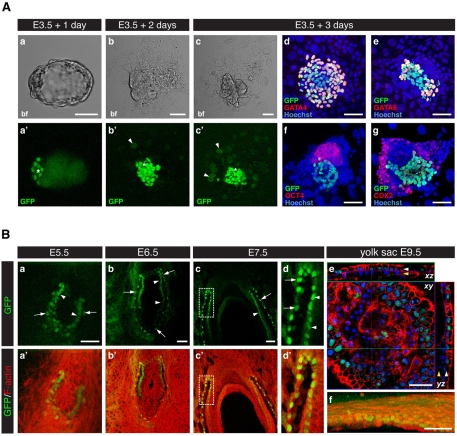
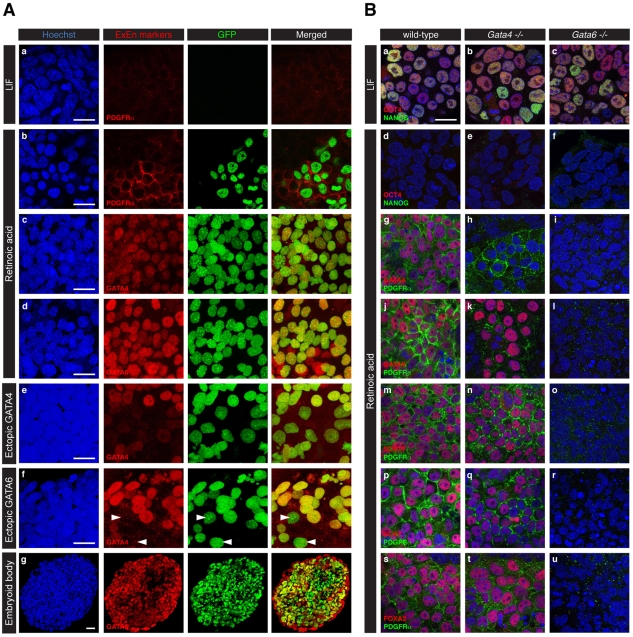
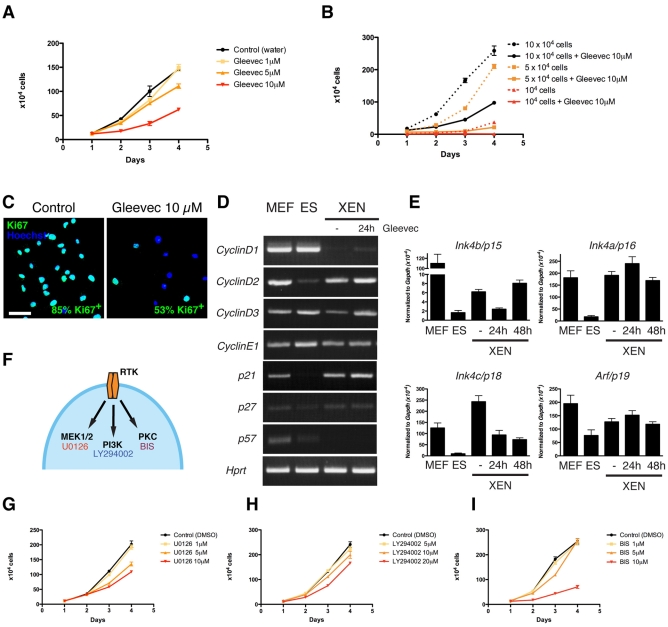
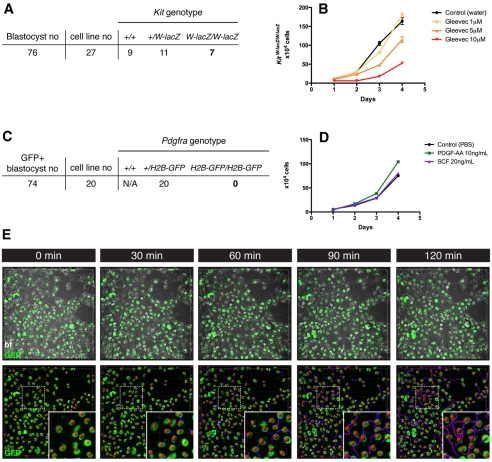
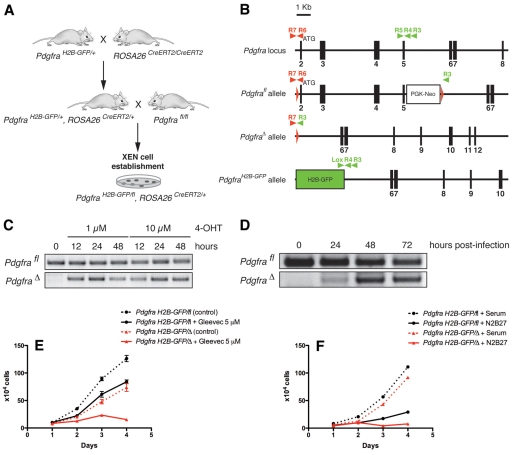
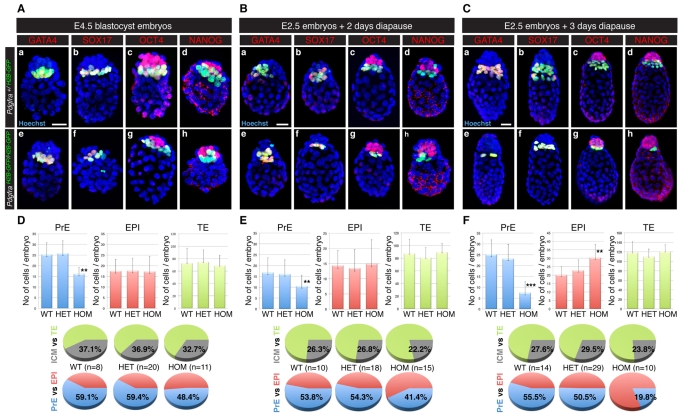
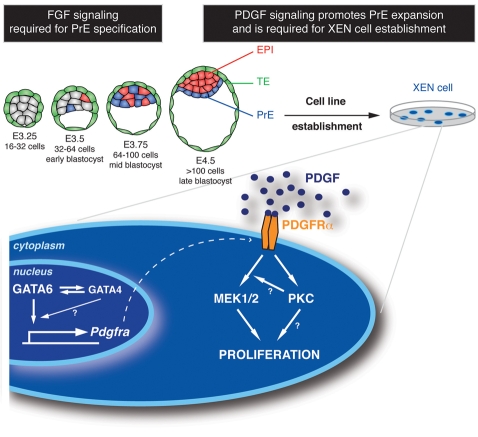
The inner cell mass (ICM) of the implanting mammalian blastocyst comprises two lineages: the pluripotent epiblast (EPI) and primitive endoderm (PrE). We have identified platelet-derived growth factor receptor alpha (PDGFRα) as an early marker of the PrE lineage and its derivatives in both mouse embryos and ex vivo paradigms of extra-embryonic endoderm (ExEn). By combining live imaging of embryos and embryo-derived stem cells expressing a histone H2B-GFP fusion reporter under the control of Pdgfra regulatory elements with the analysis of lineage-specific markers, we found that Pdgfra expression coincides with that of GATA6, the earliest expressed transcriptional regulator of the PrE lineage. We show that GATA6 is required for the activation of Pdgfra expression. Using pharmacological inhibition and genetic inactivation we addressed the role of the PDGF pathway in the PrE lineage. Our results demonstrate that PDGF signaling is essential for the establishment, and plays a role in the proliferation, of XEN cells, which are isolated from mouse blastocyst stage embryos and represent the PrE lineage. Implanting Pdgfra mutant blastocysts exhibited a reduced number of PrE cells, an effect that was exacerbated by delaying implantation. Surprisingly, we also noted an increase in the number of EPI cells in implantation-delayed Pdgfra-null mutants. Taken together, our data suggest a role for PDGF signaling in the expansion of the ExEn lineage. Our observations also uncover a possible role for the PrE in regulating the size of the pluripotent EPI compartment.


Figures

Fig. 1.
Fig. 1.
Pdgfra is expressed in the primitive endoderm (PrE) and its extra-embryonic endoderm (ExEn) derivatives. (A) Pdgfra expression during mouse blastocyst outgrowth. (a-c) Single bright-field (bf) optical sections of PdgfraH2B-GFP/+ blastocyst cultured in vitro for 3 days. (a′-c′) GFP (green) is expressed in the inner cell mass (ICM; asterisk). (b′,c′) GFP is weakly detected in trophoblast giant cells (TGCs; arrowheads). (d,e) After 3 days in culture, GFP colocalizes with PrE markers GATA4 (d, red) and GATA6 (e, red). (f,g) Mutually exclusive expression of GFP, OCT4 (f, red) and CDX2 (g, red) after 3 days culture. (a'-c',d-g) Three-dimensional projections of z-stacks. (B) (a-d′) Pdgfra expression in the PrE derivatives parietal endoderm (PE, arrows) and visceral endoderm (VE, arrowheads) at E5.5 (a), E6.5 (b) and E7.5 (c,d). (c,c′) Extra-embryonic region of an E7.5 embryo. (a-c′) Three-dimensional projections of z-stacks. (d,d′) Magnified view of the boxed region from c and c′. (e,f) GFP is detected in the endoderm of the visceral yolk sac at E9.5. (e) Orthogonal views of z-stack of an E9.5 yolk sac. (f) Three-dimensional projection of e. White arrowhead, VE; yellow arrowhead, mesoderm derivatives of the yolk sac. Blue, Hoechst; green, GFP; red, F-actin. Scale bars: 50 μm.
Fig. 2.
Fig. 2.
Pdgfra expression in ex vivo models of PrE formation is regulated by GATA6. (A) (a) PdgfraH2B-GFP/+ mouse ES cells propagated in the presence of LIF do not express PDGFRα protein or GFP reporter. (b-d) Upon retinoic acid (RA) treatment, both nuclear-localized GFP and endogenous PDGFRα protein are detected (b). GFP-positive cells express GATA4 (c) and GATA6 (d). (e,f) Expression of GFP and GATA4 is detected 48 hours after ectopic expression of GATA4 (e) or GATA6 (f). Few GFP-positive cells do not express GATA4 (arrowheads) upon GATA6 misexpression. (g) Section through an embryoid body at 5 days of differentiation. Cells in the outer layer express GATA6 but not the GFP reporter. (a,b) Single optical section. (c-g) Three-dimensional projections of the z-stacks. Blue, Hoechst; green, GFP; red, PDGFRα, GATA4 or GATA6. (B) Requirement for GATA6, but not GATA4, for Pdgfra expression upon RA treatment. (a-c) Wild-type (a), Gata4–/– (b) and Gata6–/– (c) ES cells cultured in the presence of LIF express the pluripotency markers OCT4 and NANOG. (d-f) Upon RA treatment, ES cell differentiation is visualized by loss of Oct4 and Nanog expression. (g-u) ExEn formation induced by RA treatment is visualized by co-expression of PDGFRα, GATA4, GATA6, SOX17, SOX7 and FOXA2. Like wild-type ES cells (left column), Gata4–/– ES cells differentiate into ExEn (middle column). In the absence of Gata6, ES cells fail to differentiate into ExEn derivatives (right column). (a-u) Single optical sections. Blue, Hoechst; green, NANOG (a-f) or PDGFRα (g-u); red, OCT4 (a-f), GATA4 (g-i), GATA6 (j-l), SOX17 (m-o), SOX7 (p-r) or FOXA2 (s-u). Scale bars: 20 μm.
Fig. 3.
Fig. 3.
Inhibition of RTK activity, MEK1/2 or PKC signaling affects XEN cell proliferation. (A) Dose-dependent effect of Gleevec. Gleevec concentrations: 0 (black), 1 (yellow), 5 (orange) and 10 (red) μM. (B) Cell density-dependent effect of Gleevec. Cells were plated at 1×10⁴ (red), 5×10⁴ (orange) and 10×104 (black) cells/well (24-well plate) in the presence of 10 μM Gleevec (solid lines; dotted lines indicate controls). (C) Reduction in the number of Ki67-positive cells after 48 hours of Gleevec treatment. Blue, Hoechst; green, Ki67. Scale bar: 50 μm. (D,E) RT-PCR (D) and qPCR (E) analyses of cell cycle regulator expression in mouse embryonic fibroblast (MEF), ES and extra-embryonic endoderm (XEN) cells in the presence and absence of Gleevec. (F) Schematic representation of signal transduction pathways activated upon ligand binding to RTK; the inhibitors used to block their activities are indicated. (G-I) Proliferation curves depicting the effect of 1-10 μM U0126 (G), 5-20 μM LY294002 (H) and 1-10 μM BIS (I). Cells were split at 5×10⁴ cells/well (24-well plate). Error bars indicate s.e.m.
Fig. 4.
Fig. 4.
PDGFRα, but not KIT, signaling is required for XEN cell establishment. (A) Isolation of Kit-deficient XEN cell lines. (B) Dose-dependent effect of Gleevec in the absence of Kit. Kit-deficient XEN cells were plated at 5×10⁴ cells/well (24-well plate) and treated with Gleevec at final concentrations of 0 (black), 1 (yellow), 5 (orange) and 10 (red) μM. (C) Failure to isolate Pdgfra-deficient XEN cell lines. (D) Effect of the addition of recombinant PDGF-AA (green) or SCF (purple) on XEN cells, compared with control (black). Wild-type XEN cells plated at 5×10⁴ cells/well (24-well plate); 10 ng/ml PDGF-AA or 20 ng/ml SCF was added to the serum-free N2B27 cell culture medium. Error bars indicate s.e.m. (E) Four-dimensional time-lapse imaging of PdgfraH2B-GFP/+ XEN cells showing homogeneous levels of fluorescence during the acquisition period. Nuclear GFP staining allows cell tracking. Insets show the boxed region (dashed line) at higher magnification. z-stacks were acquired every 15 minutes for a total of 15 hours. Green, GFP; red, tracked nucleus; purple, dragon tail.
Fig. 5.
Fig. 5.
Conditional inactivation of Pdgfra in XEN cells impairs their proliferation. (A) Strategy for isolating PdgfraH2B-GFP/fl; ROSA26CreERT2/+ XEN cells. (B) Schematic representation of Pdgfra alleles and genotyping primers used (arrowheads). (C) PCR detection of floxed and deleted alleles upon addition of 4-OHT for the indicated periods of time. (D) PCR detection of floxed and deleted alleles after infection with Cre-expressing retrovirus. (E,F) Proliferation curves of PdgfraH2B-GFP/fl (black) and PdgfraH2B-GFP/+ (red) XEN cell lines depict (E) the effect of 5 μM Gleevec and (F) the failure of PdgfraH2B-GFP/+ XEN cells to proliferate in N2B27 medium. Error bars indicate s.e.m.
Fig. 6.
Fig. 6.
Implantation-delayed blastocysts lacking PDGFRα exhibit defects in the PrE and pluripotent epiblast (EPI) lineages. (Aa-Ch) PdgfraH2B-GFP/+ (top row) and PdgfraH2B-GFP/H2B-GFP (bottom row) mouse embryos at E4.5 (A), 2 days (B) and 3 days (C) after tamoxifen injection. Blue, Hoechst; green, GFP; red, GATA4 (a,e), SOX17 (b,f), OCT4 (c,g) and NANOG (d,h). Scale bar: 20 μm. (D-F) Distribution of PrE (blue), EPI (red) and trophectoderm (TE; green) cells in Pdgfra+/+ (WT), PdgfraH2B-GFP/+ (HET) and PdgfraH2B-GFP/H2B-GFP (HOM) embryos at E4.5 (D), 2 days (E) and 3 days (F) after tamoxifen injection. Gray, ICM. **, P<0.007; ***, P<0.0001. Error bars indicate s.d.
Fig. 7.
Fig. 7.
Model for the role of PDGF signaling in the PrE lineage of the mouse blastocyst. Early mouse development is characterized by progressive lineage restriction ensuring the segregation of the ICM cells (gray) into epiblast (EPI, red) and primitive endoderm (PrE, blue). XEN cells are derived from the PrE of the blastocyst. GATA6, which is considered a key regulator of PrE identity, may control the expression of genes, including Gata4 and Pdgfra. The PDGF pathway exerts a mitogenic effect through MEK/PKC signaling and promotes in vivo and ex vivo PrE lineage expansion and XEN cell establishment.

References

    1. Andrae J., Gallini R., Betsholtz C. (2008). Role of platelet-derived growth factors in physiology and medicine. Genes Dev. 22, 1276-1312 - PMC - PubMed
    1. Arman E., Haffner-Krausz R., Chen Y., Heath J. K., Lonai P. (1998). Targeted disruption of fibroblast growth factor (FGF) receptor 2 suggests a role for FGF signaling in pregastrulation mammalian development. Proc. Natl. Acad. Sci. USA 95, 5082-5087 - PMC - PubMed
    1. Arnold S. J., Robertson E. J. (2009). Making a commitment: cell lineage allocation and axis patterning in the early mouse embryo. Nat. Rev. Mol. Cell Biol. 10, 91-103 - PubMed
    1. Artus J., Vandormael-Pournin S., Frodin M., Nacerddine K., Babinet C., Cohen-Tannoudji M. (2005). Impaired mitotic progression and preimplantation lethality in mice lacking OMCG1, a new evolutionarily conserved nuclear protein. Mol. Cell. Biol. 25, 6289-6302 - PMC - PubMed
    1. Batlle-Morera L., Smith A., Nichols J. (2008). Parameters influencing derivation of embryonic stem cells from murine embryos. Genesis 46, 758-767 - PubMed

Publication types

MeSH terms