

Trends in 24-h urinary sodium excretion in the United States, 1957-2003: a systematic review
- PMID: 20826631
- PMCID: PMC2954449
- DOI: 10.3945/ajcn.2010.29367
Trends in 24-h urinary sodium excretion in the United States, 1957-2003: a systematic review
Abstract
Background: Few studies have examined temporal trends in sodium intake in the US population. Collections of 24-h urine sodium excretions are reliable markers for dietary sodium intake.
Objective: We examined temporal trends in 24-h urine sodium excretions to estimate temporal trends in sodium intake in the US population.
Design: We performed a systematic search of English-language articles in MEDLINE for studies that reported collections of 24-h urine sodium excretions in the United States. We estimated mean urine sodium excretions over time for all studies and demographic subgroups.
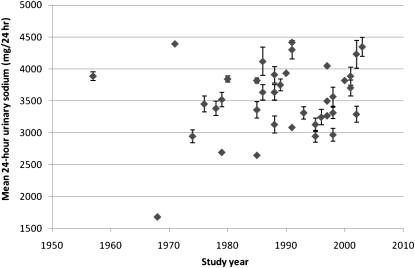
Results: We analyzed 38 studies, which dated from 1957 to 2003, and estimated a mean (± SE) 24-h urine sodium excretion per person of 3526 ± 75 mg Na. In a multivariate random-effects model with study year, sex, age, and race, the study year was not associated with any significant change in sodium excretions (coefficient = 154 mg Na · 24 h⁻¹ · 10 y⁻¹; 95% CI: -140, 448 mg Na · 24 h⁻¹ · 10 y⁻¹). In subgroup analyses, there was no significant temporal trend seen in male, female, black, or white study participants.
Conclusion: Sodium intake in the US adult population appears to be well above current guidelines and does not appear to have decreased with time.
Figures
Comment in
-
Science trumps politics: urinary sodium data challenge US dietary sodium guideline.Am J Clin Nutr. 2010 Nov;92(5):1005-6. doi: 10.3945/ajcn.110.002709. Epub 2010 Oct 6. Am J Clin Nutr. 2010. PMID: 20926523 No abstract available.
-
Urinary sodium excretion in the united states between 1957 and 2003.Nutr Rev. 2010 Dec;68(12):750. Nutr Rev. 2010. PMID: 21140593 No abstract available.
-
Is a trend to reduced sodium intake in the United States concealed by obesity?Am J Clin Nutr. 2011 Mar;93(3):670-1; author reply 671-2. doi: 10.3945/ajcn.110.009373. Epub 2011 Jan 19. Am J Clin Nutr. 2011. PMID: 21248186 No abstract available.
References
-
- National Center for Health Statistics Health, United States, 2008, with chartbook. Hyattsville, MD: National Center for Health Statistics, 2009
-
- Fields LE, Burt VL, Cutler JA, Hughes J, Roccella EJ, Sorlie P. The burden of adult hypertension in the United States 1999 to 2000: a rising tide. Hypertension 2004;44:398–404 - PubMed
-
- Cutler JA, Sorlie PD, Wolz M, Thom T, Fields LE, Roccella EJ. Trends in hypertension prevalence, awareness, treatment, and control rates in United States adults between 1988-1994 and 1999-2004. Hypertension 2008;52:818–27 - PubMed
-
- US Department of Health and Human Services, Centers for Disease Control and Prevention Application of lower sodium intake recommendation to adults: United States, 1999-2006. MMWR Morb Mortal Wkly Rep 2009;58:281–83 - PubMed
-
- Appel LJ, Brands MW, Daniels SR, Karanja N, Elmer PJ, Sacks FM. Dietary approaches to prevent and treat hypertension: a scientific statement from the American Heart Association. Hypertension 2006;47:296–308 - PubMed
Publication types
MeSH terms
Substances
Grants and funding
LinkOut - more resources
Full Text Sources
Medical
Research Materials
