. 2010 Sep 8;30(36):11885-95.
doi: 10.1523/JNEUROSCI.1415-10.2010.

Nanodomain control of exocytosis is responsible for the signaling capability of a retinal ribbon synapse

Affiliations

Nanodomain control of exocytosis is responsible for the signaling capability of a retinal ribbon synapse

Tim Jarsky et al. J Neurosci. .

Abstract

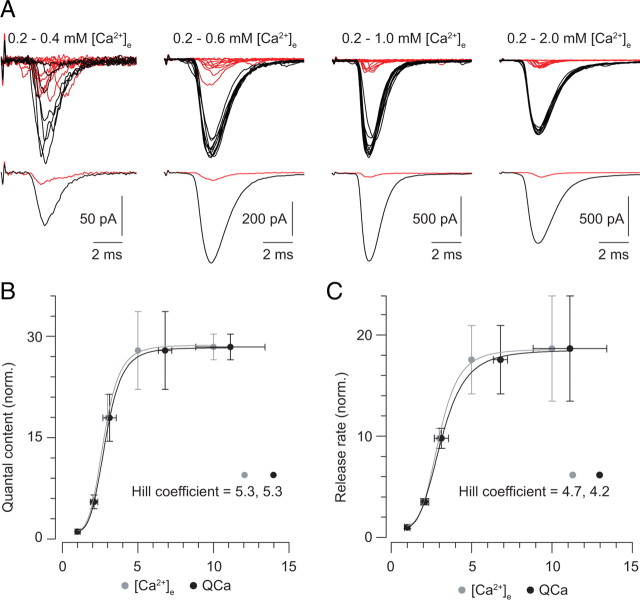
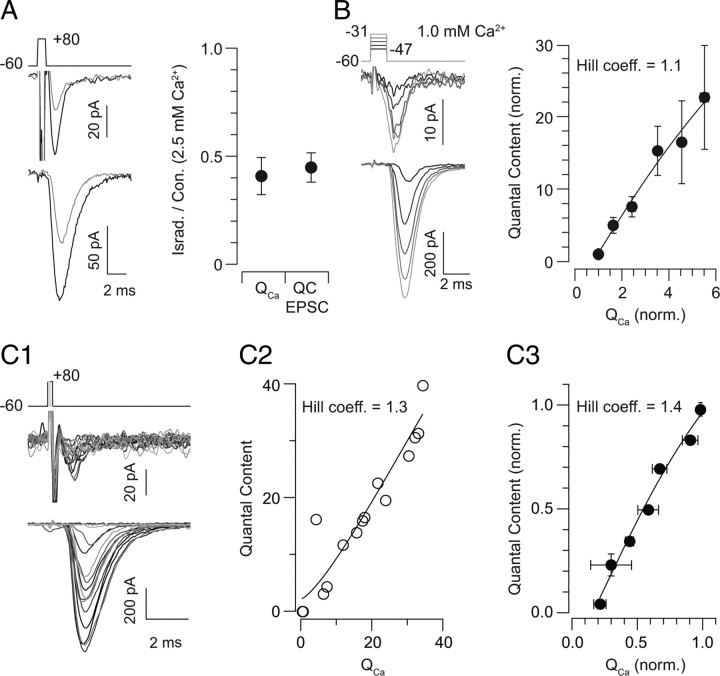
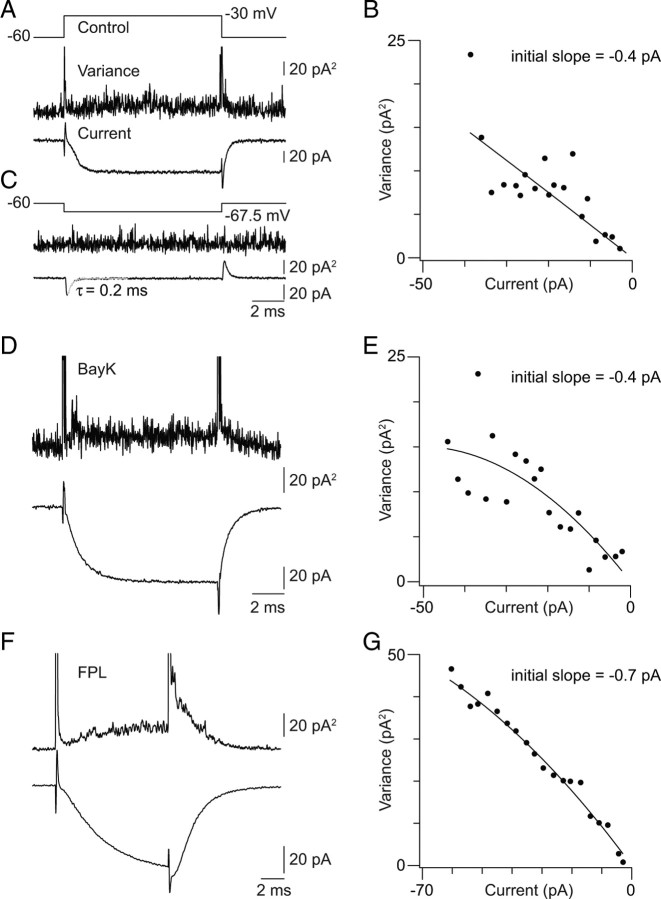
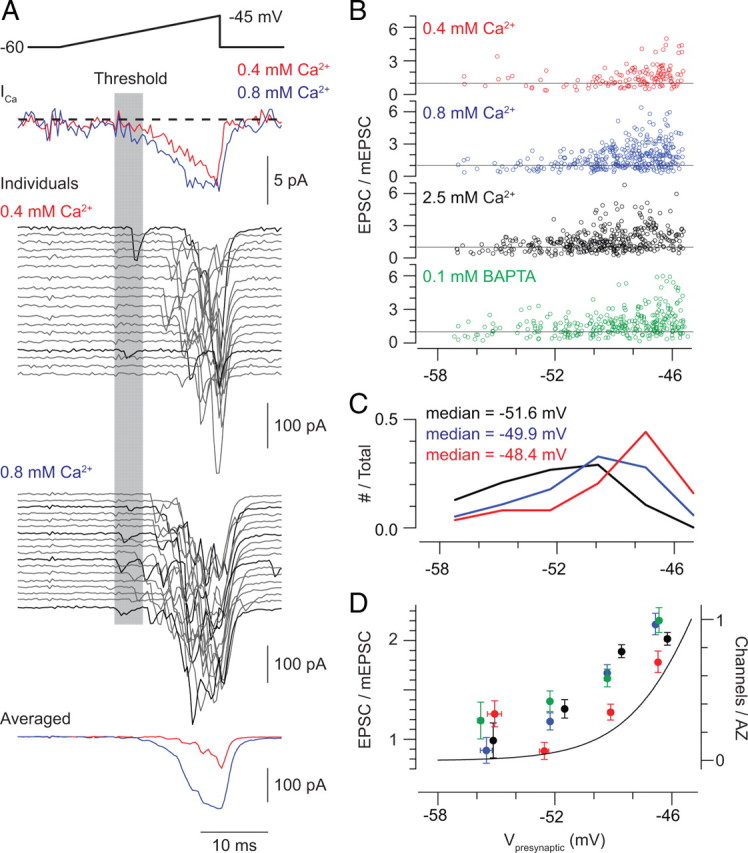
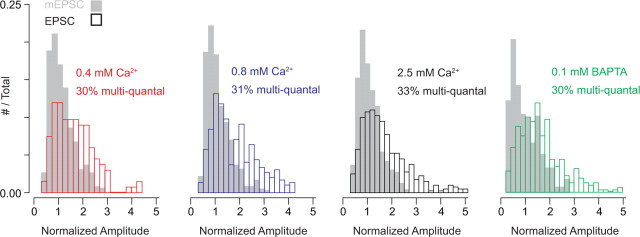
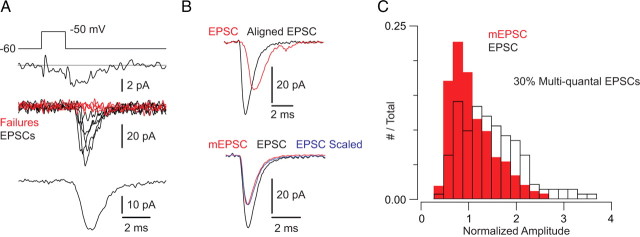
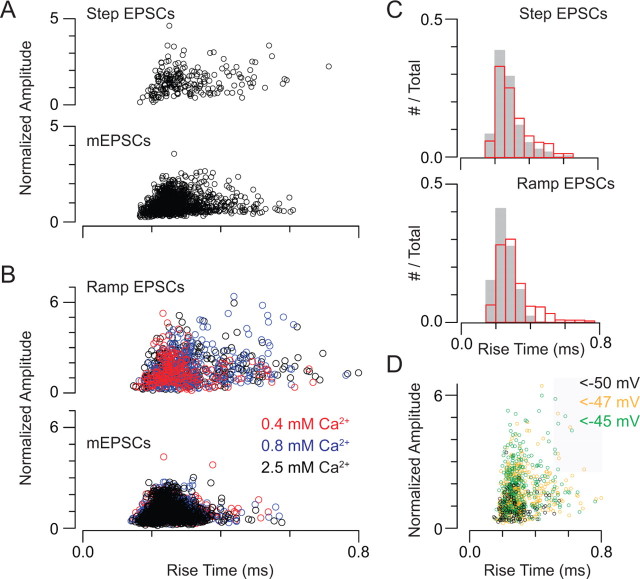
Primary sensory circuits encode both weak and intense stimuli reliably, requiring that their synapses signal over a wide dynamic range. In the retinal circuitry subserving night vision, processes intrinsic to the rod bipolar (RB) cell presynaptic active zone (AZ) permit the RB synapse to encode signals generated by the absorption of single photons as well as by more intense stimuli. In a study using an in vitro slice preparation of the mouse retina, we provide evidence that the location of Ca channels with low open probability within nanometers of the release sites is a critical determinant of the physiological behavior of the RB synapse. This gives rise to apparent one-to-one coupling between Ca channel opening and vesicle release, allowing presynaptic potential to be encoded linearly over a wide dynamic range. Further, it permits a transition from univesicular to multivesicular release (MVR) when two Ca channels/AZ open at potentials above the threshold for exocytosis. MVR permits small presynaptic voltage changes to elicit postsynaptic responses larger than quantal synaptic noise.


Figures

Figure 1.
Figure 1.
Exocytosis is steeply dependent on [Ca2+]e. A, Representative tail Ca current-evoked EPSCs recorded in 0.2 mm Ca2+ (red) and 0.4–2 mm Ca2+ (black); each panel illustrates a different paired recording. Note the existence of failures of transmission in each of the recordings in 0.2 mm Ca2+. B, The quantal content of the EPSCs is plotted against [Ca2+]e (gray) and QCa (the Ca current integral; black). All three are normalized to the 0.2 mm Ca2+ condition. The relationships are fit well by a Hill function with a coefficient of ∼5. C, The release rate reflected by the EPSCs is plotted against [Ca2+]e (gray) and QCa (the Ca current integral; black). Again, release rate, [Ca2+], and QCa are normalized to the 0.2 mm Ca2+ condition, and the relationships are well fit by a Hill function with a coefficient of ∼5.
Figure 2.
Figure 2.
Exocytosis varies linearly with the number of open Ca channels. A, In a saturating [Ca2+]e, application of the Ca channel antagonist isradipine reduces presynaptic Ca influx and EPSC quantal content equivalently (to 41 ± 7% and 45 ± 9% of control, and QCa and EPSC quantal content, respectively; n = 3). Representative traces are on the left (black = control; gray = isradipine, 3 μm), and summary data are on the right. B, Presynaptic voltage steps (1.5 ms) from −60 mV to potentials between −47 and −31 mV [in 4 mV increments; grayscale from −47 mV (dark) to −31 mV (light)] elicit Ca currents (top) and EPSCs (bottom). At right, EPSC quantal content is plotted against QCa, illustrating a near-linear relationship between Ca2+ influx and exocytosis when the number of open presynaptic Ca channels is altered. Data are normalized to the condition of the smallest voltage step, in which 44 ± 5% of responses are failures of transmission (n = 10). [Ca2+]e = 1 mm. C1, Presynaptic voltage steps of increasing duration (0.1–0.3 ms) from −60 to +80 mV elicit Ca tail currents and EPSCs of increasing amplitude ([Ca2+]e = 1 mm). C2, The relationship between EPSC quantal content and presynaptic Ca charge transfer observed in a single cell is approximately linear and described by a Hill function with a coefficient of 1.3. C3, A summary of the quantal content–QCa relationship: data from each recorded pair were normalized to the maximal response recorded in that pair; data then were binned in increments of 0.15. The binned data are fit well by a Hill function with a coefficient of 1.3 (n = 3 recorded pairs).
Figure 3.
Figure 3.
Estimation of the single Ca channel current; [Ca2+]e = 2.5 mm. A, Average trial-to-trial variance (middle trace) and current (leak subtracted, bottom trace) elicited by a 10 ms step from −60 to −30 mV (top trace). B, The binned current–variance relationship for the recording illustrated in A. C, Changes in current variance are not associated with voltage steps that do not activate Ca currents. The voltage step used for P/4 leak subtraction of the current illustrated in A is shown. D, Ca current (leak subtracted) and variance around the mean elicited by a 10 ms voltage step in the presence of 10 μm BayK. E, The binned current–variance relationship for the recording illustrated in D. Note that BayK does not increase the measured single Ca channel current. F, Ca current (leak subtracted) and variance around the mean elicited by a 10 ms voltage step in the presence of 5 μm FPL. Note the slowed activation and deactivation of the current. G, The current–variance relationship for the recording illustrated in F. Note the increased single Ca channel current observed in the presence of FPL.
Figure 4.
Figure 4.
Voltage-ramp stimuli reveal the presynaptic voltage threshold for exocytosis. A, Ramp depolarization from −60 to −45 mV elicits presynaptic Ca currents (top) and evoked EPSCs (below). Individual (middle) and averaged (bottom) responses recorded in 0.4 and 0.8 mm Ca2+ are illustrated. It is possible to identify trials in which evoked transmission occurs at the voltage threshold for Ca current activation (black). B, For three [Ca2+]e (0.4, 0.8, and 2.5 mm) with 1 mm BAPTA in the pipette solution and for one [Ca2+]e (1 mm) with 0.1 mm BAPTA in the pipette solution, the amplitudes of each evoked EPSC are normalized to the average mEPSC amplitude (for each cell) and plotted against the presynaptic voltage (data pooled from 3 recorded pairs for each condition). It is obvious that multiquantal EPSCs are evoked only at potentials depolarized to the threshold for exocytosis. C, The voltages at which the first evoked response is observed during recordings in 0.4, 0.8, and 2.5 mm Ca2+ are displayed; voltages are binned in increments of 2 mV (n = 3 paired recordings for each condition). In all conditions, release events are observed at the threshold for Ca current activation, but the frequency of observing events at this threshold increases with [Ca2+]e. D, Averaged EPSC amplitudes for each experimental condition (normalized to mEPSC amplitude; left-hand y-axis) and the estimated number of open Ca channels per AZ (calculated by dividing the average of ramp-evoked Ca currents recorded in 9 RBs in 2.5 mm Ca2+ by the single-channel current measured by NSV and then by 40—the estimated number of presynaptic AZs; green trace, right-hand y-axis) plotted against presynaptic membrane potential. Data are binned in 3 mV increments.
Figure 5.
Figure 5.
Approximately 30% of evoked events are multiquantal. Histograms of mEPSC (gray bars) and ramp-evoked EPSC (open bars) amplitudes (normalized to mean mEPSC amplitude) recorded in 0.4, 0.8, and 2.5 mm Ca2+ and in 1 mm Ca2+ with 0.1 mm BAPTA in the presynaptic pipette. Distributions reflect data pooled from 3 recorded pairs in each condition. For all conditions, ∼30% of the evoked events are multiquantal, as determined by calculating the area of the evoked event distribution that does not overlap with the mEPSC distribution.
Figure 6.
Figure 6.
Multiquantal EPSCs evoked by the opening of ∼1 channel/AZ. A, A 10 mV, 1.5 ms presynpatic depolarization elicits small presynaptic tail Ca currents (top) and evokes EPSCs with a high percentage of failures of transmission (middle: individual EPSCs; bottom: average of all events including failures). B, There is substantial jitter in evoked transmission. Top, If evoked events are aligned at their starting points, the averaged EPSC waveform is larger and faster (black) than the nonaligned average (red). Bottom, The aligned and averaged EPSC (black) is larger than the quantal mEPSC (red) but has the identical time course, as illustrated by the scaled trace (blue). C, Evoked EPSC and mEPSC distributions (data pooled from 4 recorded pairs; EPSCs and mEPSCs normalized to the mean mEPSC amplitude) illustrate that 30% of the evoked events are multiquantal, as determined by calculating the area of the evoked event distribution that does not overlap with the mEPSC distribution.
Figure 7.
Figure 7.
Multiquantal EPSCs have fast rise times. A, Amplitude–rise time relationship for step-evoked EPSCs and mEPSCs recorded in the same experiment. Data are pooled from 4 recorded pairs, and amplitudes are normalized to the mean mEPSC amplitude. B, Amplitude–rise time relationship for ramp-evoked EPSCs and mEPSCs recorded in the same experiment. Recordings in various [Ca2+]e are differentiated by color. Data are pooled from 6 recorded pairs, and amplitudes are normalized to the mean mEPSC amplitude. C, Histograms of EPSC and mEPSC rise times for experiments in which EPSCs were evoked by small presynaptic voltage steps (top) and presynaptic voltage ramps (bottom). D, Plot of EPSC amplitude versus rise time; color code reflects the presynaptic voltage at which the EPSC was evoked. It is evident that large EPSCs are not recorded at presynaptic potentials <−50 mV, and that large, slow EPSCs can be evoked at all potentials >−50 mV. The gray area denotes EPSCs with amplitude >2.5 quanta and rise time >0.5 ms (2 SDs above the mean).

References

    1. Ames A, 3rd, Nesbett FB. In vitro retina as an experimental model of the central nervous system. J Neurochem. 1981;37:867–877. - PubMed
    1. Berjukow S, Marksteiner R, Gapp F, Sinnegger MJ, Hering S. Molecular mechanism of calcium channel block by isradipine. Role of a drug-induced inactivated channel conformation. J Biol Chem. 2000;275:22114–22120. - PubMed
    1. Berntson A, Taylor WR, Morgans CW. Molecular identity, synaptic localization, and physiology of calcium channels in retinal bipolar cells. J Neurosci Res. 2003;71:146–151. - PubMed
    1. Bertram R, Smith GD, Sherman A. Modeling study of the effects of overlapping Ca2+ microdomains on neurotransmitter release. Biophys J. 1999;76:735–750. - PMC - PubMed
    1. Beutner D, Voets T, Neher E, Moser T. Calcium dependence of exocytosis and endocytosis at the cochlear inner hair cell afferent synapse. Neuron. 2001;29:681–690. - PubMed

Publication types

MeSH terms

Substances