. 2010 Sep 8;30(36):11938-50.
doi: 10.1523/JNEUROSCI.2357-10.2010.

Abeta oligomers cause localized Ca(2+) elevation, missorting of endogenous Tau into dendrites, Tau phosphorylation, and destruction of microtubules and spines

Affiliations

Abeta oligomers cause localized Ca(2+) elevation, missorting of endogenous Tau into dendrites, Tau phosphorylation, and destruction of microtubules and spines

Hans Zempel et al. J Neurosci. .

Erratum in

  • J Neurosci. 2012 Apr 25;32(17):6052

Abstract

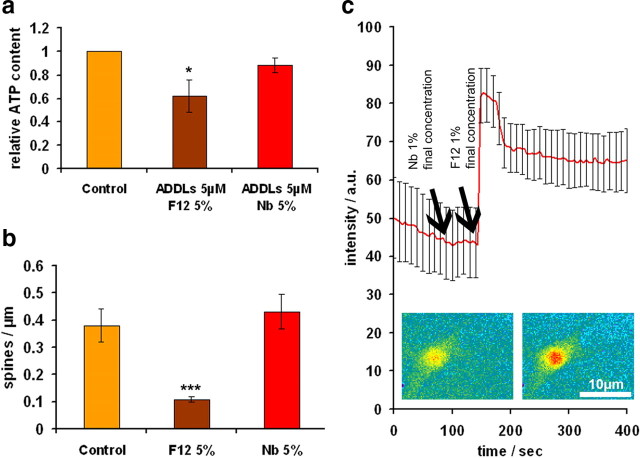
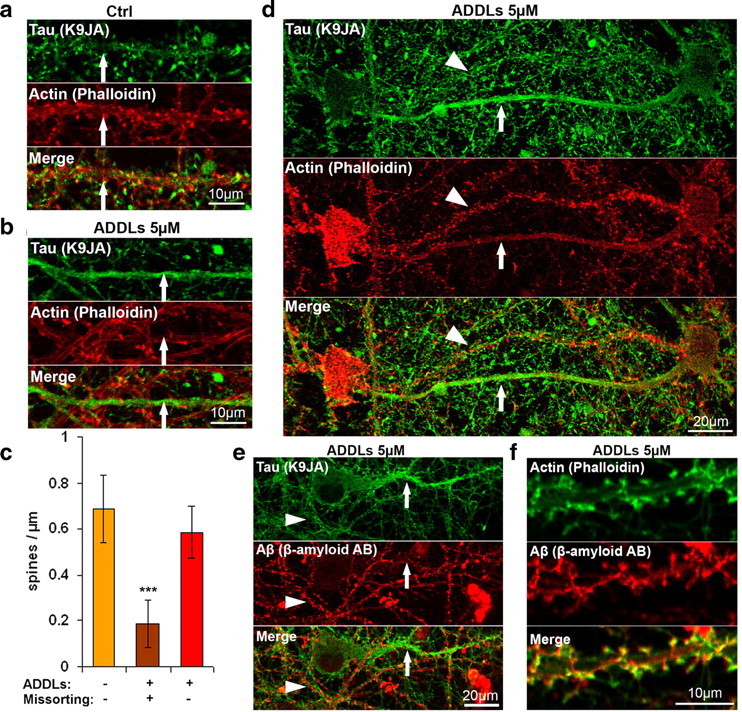
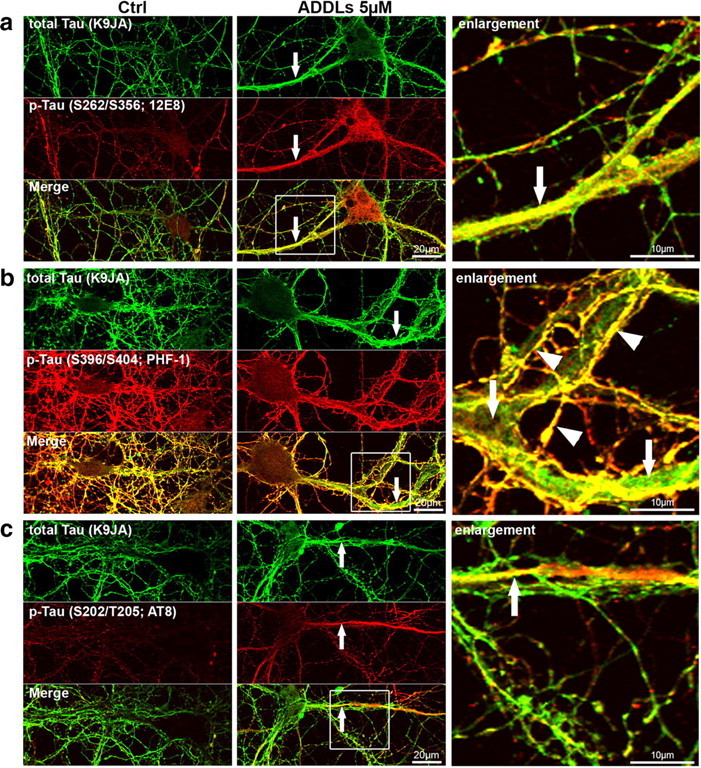
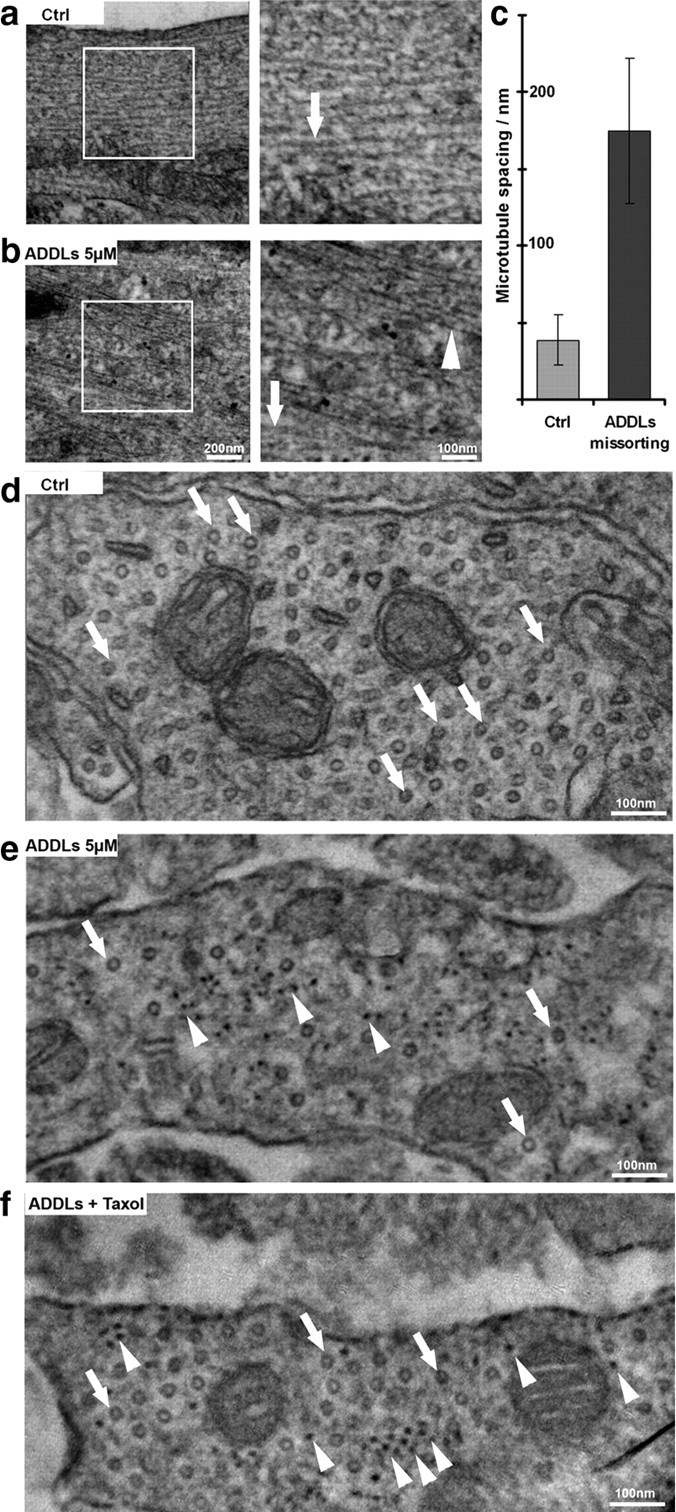
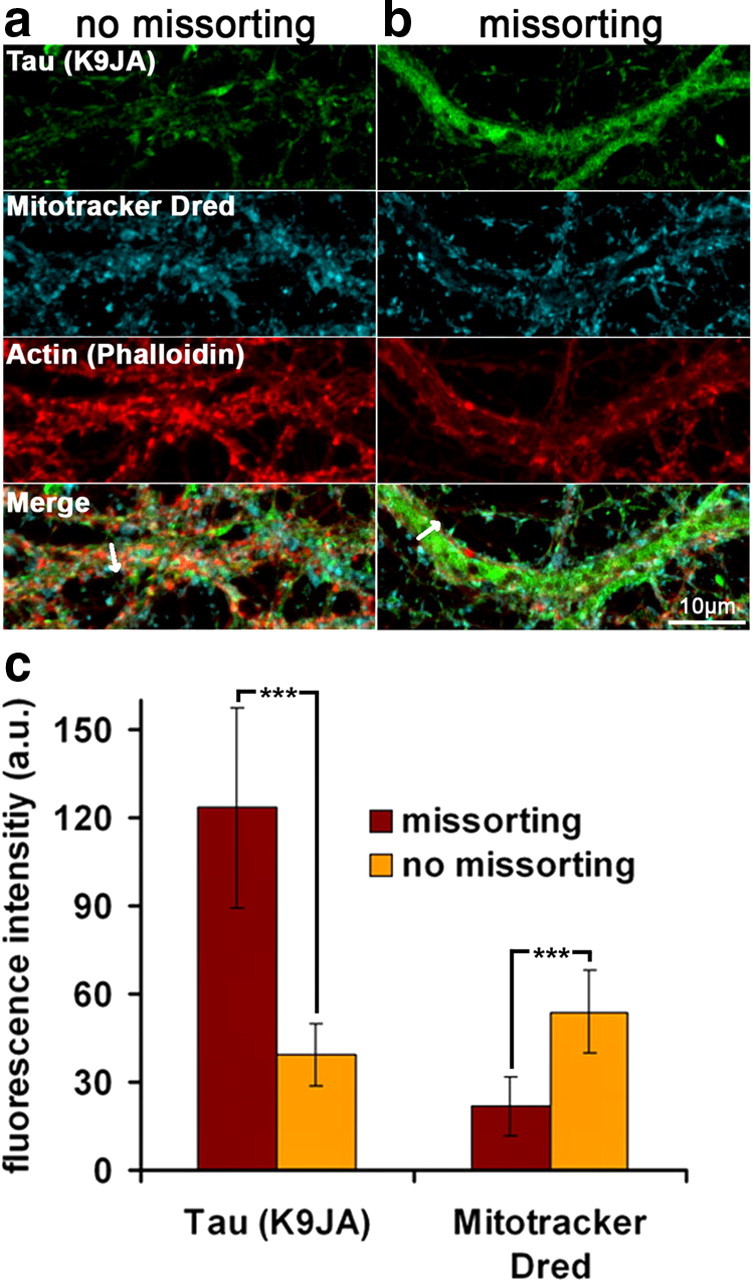
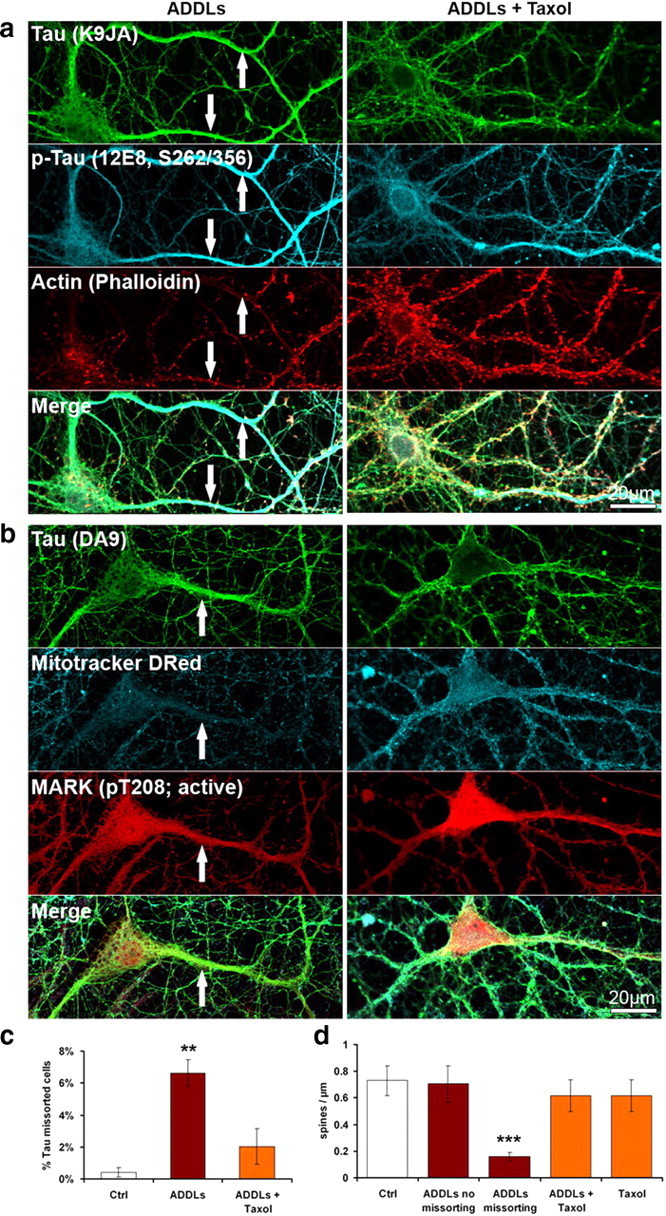
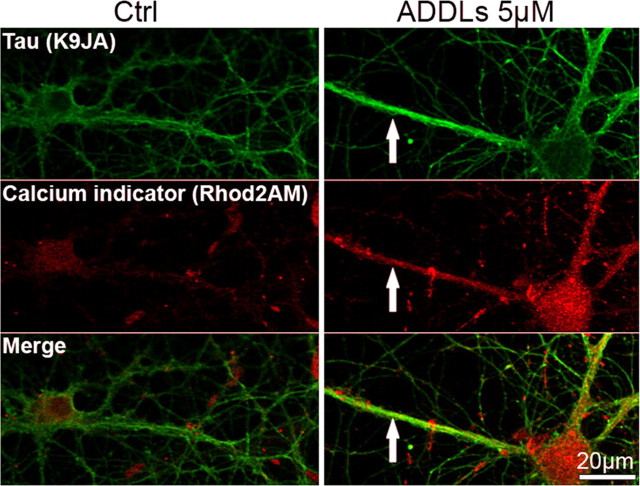
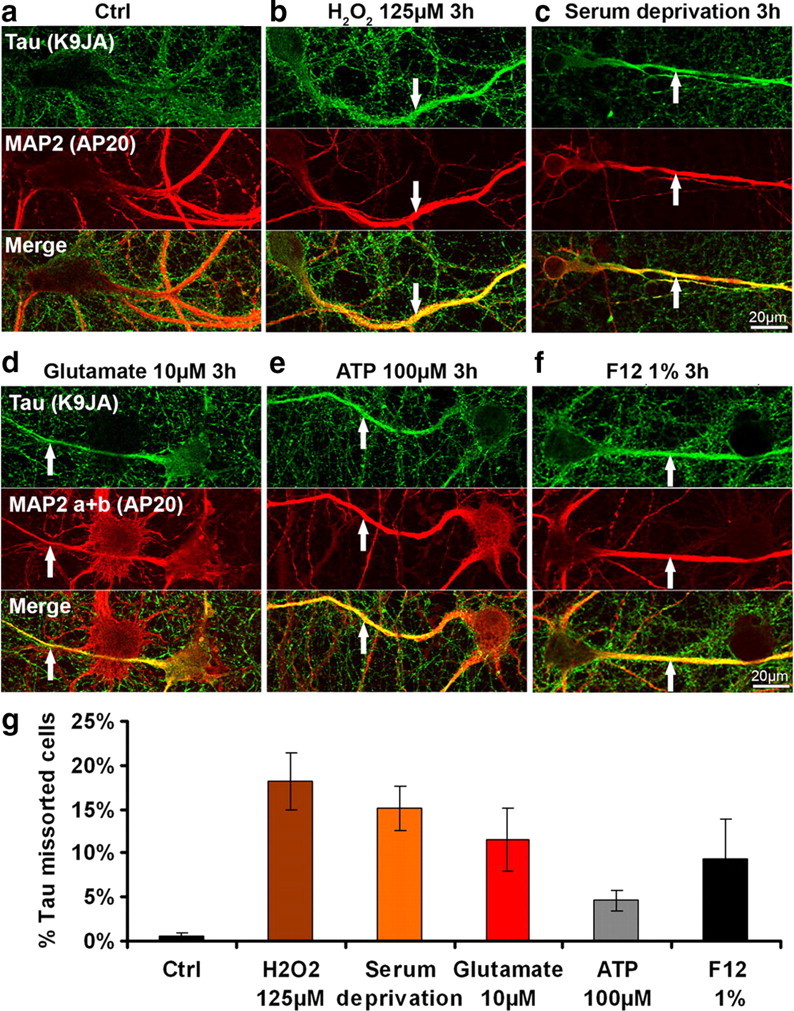
Aggregation of amyloid-beta (Abeta) and Tau protein are hallmarks of Alzheimer's disease (AD), and according to the Abeta-cascade hypothesis, Abeta is considered toxic for neurons and Tau a downstream target of Abeta. We have investigated differentiated primary hippocampal neurons for early localized changes following exposure to Abeta oligomers. Initial events become evident by missorting of endogenous Tau into the somatodendritic compartment, in contrast to axonal sorting in normal neurons. In missorted dendritic regions there is a depletion of spines and local increase in Ca(2+), and breakdown of microtubules. Tau in these regions shows elevated phosphorylation at certain sites diagnostic of AD-Tau (e.g., epitope of antibody 12E8, whose phosphorylation causes detachment of Tau from microtubules, and AT8 epitope), and local elevation of certain kinase activities (e.g., MARK/par-1, BRSK/SADK, p70S6K, cdk5, but not GSK3beta, JNK, MAPK). These local effects occur without global changes in Tau, tubulin, or kinase levels. Somatodendritic missorting occurs not only with Tau, but also with other axonal proteins such as neurofilaments, and correlates with pronounced depletion of microtubules and mitochondria. The Abeta-induced effects on microtubule and mitochondria depletion, Tau missorting, and loss of spines are prevented by taxol, indicating that Abeta-induced microtubule destabilization and corresponding traffic defects are key factors in incipient degeneration. By contrast, the rise in Ca(2+) levels, kinase activities, and Tau phosphorylation cannot be prevented by taxol. Incipient and local changes similar to those of Abeta oligomers can be evoked by cell stressors (e.g., H(2)O(2), glutamate, serum deprivation), suggesting some common mechanism of signaling.


Figures

Figure 1.
Figure 1.
Oligomers of Aβ (ADDLs) dissolved in different cell culture media display various aggregated species. a, Depending on the gel conditions and the solvents used (DMSO and either F12 or Nb cell culture medium), ADDL preparations display Aβ monomers, different oligomers, and higher-molecular-weight aggregates. Denaturation was done by boiling the ADDL preparation in sample buffer (SB) containing SDS and β-mercaptoethanol (ME) for 10 min at 95°C. A total of 450 ng (100 pmol) were applied to 10–20% gradient gels. b, Immunoreactivity of Aβ oligomers with antibody A11 is stronger in F12 medium than in Nb medium. c, Negative stain electron microscopy of Aβ oligomer preparation of the same concentration used for cell experiments. ADDL stock solution (100 μm) was diluted to 5 μm in Nb medium. The prominent features are globular particles that are equivalent to higher n oligomers and aggregates thereof. d, Quantification of the relative distribution of oligomers depending on the diameter.
Figure 2.
Figure 2.
F12 vehicle is toxic to primary neurons. Primary hippocampal neurons were treated either with Ham's F12 (F12) or Nb cell culture medium supplemented with 2% DMSO. a, ATP content of neurons (a measure of cell viability) is reduced after 3 h treatment with ADDLs dissolved in 5% F12/0.1% DMSO, the vehicle commonly used to dissolve Aβ for ADDL preparations (e.g., (Lambert et al., 1998). Note that ATP is reduced for ADDLs dissolved in F12 medium, but not reduced for the case of ADDLs dissolved in Neurobasal/DMSO vehicle (5% Nb/0.1% DMSO). b, The number of spines is strongly reduced in F12/DMSO (5%/0.1%) after 24 h of treatment, compared with Nb/DMSO (5%/0.1%) or control neurons. c, Application of Nb/DMSO (1%/0.02%) (left arrow) causes no noticeable calcium influx into neurons. In contrast, F12/DMSO (1%/0.02%) (right arrow) results in a major and prolonged calcium influx, visualized fluorimetrically after labeling cells with Fluo-4/F127. The cells in insets represent low and high calcium states (left and right). Error bars: a, SEM from 3–5 experiments; b, SD from 10–20 dendrites c, SD from 10 neurons. Scale bar, 10 μm. *p < 0.05 and ***p < 0.001 versus control (one-way ANOVA with post hoc Bonferroni).
Figure 3.
Figure 3.
Aβ oligomers induce missorting of Tau and neurofilaments into the somatodendritic compartment of primary hippocampal neurons. a, In vehicle-treated control cells (Nb/DMSO, 5%/0.1%), Tau is predominantly localized to the axonal compartment (top, Tau stained by antibody K9JA, green), while MAP2 is localized to the somatodendritic compartment (middle, MAP2 stained by antibody AP20, red). Merge, bottom. There is no colocalization of Tau and MAP2. b, In ADDL-treated cells (5 μm for 3 h) Tau is redistributed into soma and dendrites (top), where it colocalizes with MAP2 (middle; merged images shown in bottom). Arrows indicate colocalization of MAP2 and Tau. c, d, Same experiment as a, b, but green color represents neurofilament staining. Dendrites were identified by MAP2 antibody staining (red color). Cells: primary hippocampal neurons 22 DIV, treated either with vehicle or 5 μm ADDLs for 3 h. Scale bars, 20 μm.
Figure 4.
Figure 4.
Redistribution of endogenous Tau into the somatodendritic compartment leads to reduced spine number. a, b, Primary hippocampal neurons (23 DIV) were treated with vehicle (Nb/DMSO, 5%/0.1%) (a), or with 5 μm ADDLs for 6 h (b) and stained for Tau by K9JA (green, top) and F-actin by phalloidin (red, middle). Merged images of a and b are shown in the bottom panel. In vehicle-treated cells (a), Tau is not present in dendrites, and the dendrites have a normal spine distribution (arrow). In ADDL-treated cells (b), Tau can be observed in dendrites, and in these cases the spine number is dramatically reduced (arrow). Dendrites were identified by morphometric characteristics and presence of spines. c, Quantification of spine density on dendrites. Left bar, Vehicle-treated cells that do not display Tau redistribution into the somatodendritic compartment. Middle bar, Aβ-treated cells demonstrating Tau-containing dendrites. Right bar, Aβ-treated cells showing normal spine density of dendrites without Tau in the same culture. Error bars, SD from n = 10–15 dendrites. ***p < 0.001 versus control (one-way ANOVA with post hoc Bonferroni). d, Example of two nearby dendrites after treatment with ADDLs (5 μm). The bottom shows Tau redistribution and loss of synapses (arrow), while the other is free of Tau and contains normal spines (arrowhead). e, Example of nearby dendrites after treatment with ADDLs (5 μm) and stained for Tau (top) and Aβ (bottom; merge at bottom). One dendrite (arrow) shows Tau redistribution and no staining for ADDLs, while others are free of Tau and are decorated with Aβ (arrowhead). f, Example of colocalization of Aβ and spines after 3 h of exposure to 5 μm ADDLs. Aβ oligomers localize to dendrites and particularly to spines, as indicated with phalloidin staining (top, green) and staining for Aβ (bottom, merge at bottom). Scale bars: a, b, f, 10 μm; d, e, 20 μm.
Figure 5.
Figure 5.
Aβ-induced Tau redistribution leads to local increase in Tau phosphorylation. Primary hippocampal neurons were treated for 3 h with vehicle (left, Nb/DMSO, 5%/0.1%) or 5 μm ADDLs (middle panels, magnification of merged images right panels). Cells were then stained with Tau phosphorylation-independent antibody (K9JA) or phosphorylation-dependent antibodies. Regions of missorted Tau (indicated by arrows) show elevated phosphorylation at some epitopes, e.g., 12E8 (a) or AT8 (c), while PHF-1 epitope is not present in dendrites containing Tau (b). Note that in b, colocalization of K9JA and PHF-1 epitope is only present in axons (overlay of axonal staining by K9JA (green) and PHF-1 (red); yellow color, indicated by arrowheads), while the dendrite, although filled with Tau (green color, indicated by arrows), does not contain the PHF-1 phosphorylation. Scale bars: left and middle, 20 μm; right, 10 μm.
Figure 6.
Figure 6.
Aβ oligomer-induced Tau redistribution correlates with changes in kinase activities. Primary hippocampal neurons were treated for 3 h with vehicle (Ctrl; left, Nb/DMSO, 5%/0.1%) or 5 μm ADDLs (right). Cells were then stained for Tau with K9JA or DA9 to detect Tau redistribution and phosphorylation-dependent antibodies recognizing the regulating epitopes of kinases or in case of BRSK with an antibody recognizing total BRSK1. ADDL treatment had a differential effect on putative Tau kinases. Arrows indicate Tau missorting into dendrites, identifiable by morphometric characteristics such as width, length, and number. a, MARK activity is increased in ADDL-treated neurons with missorted Tau, as seen by antibody staining against active MARK (pT208). b, P70S6 kinase activity is increased in ADDL-treated neurons with missorted Tau, as seen by antibody staining against active P70S6 kinase (pT389). c, BRSK is elevated in dendrites containing missorted Tau, as seen by antibody staining against total BRSK1. d, MAPK activity is reduced in ADDL-treated neurons with missorted Tau, as seen by antibody staining against active ERK-1/2 (pT202+pY204). e, There is no difference in ADDL-induced missorted neurons and control neurons recognizable by antibody staining against active c-Jun N-terminal kinase (JNK1 + 2; pT183+pY185). f, Staining of inactive GSK3β (pS9) is unchanged in neurons displaying ADDL-induced missorting. g, cdk5 kinase activity is increased after ADDL treatment as judged by enhanced immunoreactivity with a phosphorylation-dependent antibody against active cdk5 (pS159). Scale bars, 20 μm.
Figure 7.
Figure 7.
Aβ oligomers induce changes in the cytoskeleton organization. Thin section electron microscopy of dendritic regions of hippocampal neurons (21 DIV) without or with ADDL treatment (5 μm, 3 h). a, Normal cells showing widely spaced microtubules (∼2 diameters apart, arrow) and no neurofilaments. Boxed area on left is shown enlarged on right. b, After ADDL treatment, regions of missorted endogenous Tau (identified by light microscopy after labeling of Tau) contain bundles of neurofilaments (arrowhead) and reduced number of microtubules (arrow). c, Histogram of spacing without or with ADDLs. Error bars: SEM from 4 to 5 cells from 3 independent cultures. d, e, Cross sections of dendrites (d) and dendrites with missorting (e) reveal microtubules as circular shapes (arrows) and dot-like neurofilaments (arrowheads in e). Note the strong decrease in microtubule content in ADDL-induced Tau missorted hippocampal neurons, and the appearance of neurofilaments in e. f, Cross sectioned dendrites after cotreatment with ADDLs and taxol show rescue of microtubules (arrows) and the presence of neurofilaments (arrowheads). Scale bars: a, b left, 200 nm; a, b right; d–f, 100 nm.
Figure 8.
Figure 8.
Aβ oligomer treatment results in decreased mitochondria number in Tau missorted dendrites. Primary hippocampal neurons were treated with ADDLs (3 h, 5 μm) and labeled with Mitotracker Deep Red, fixed, and stained with antibody K9JA and phalloidin to visualize Tau and F-actin. Dendrites were identified by presence of spines and morphometric characteristics. a, Dendrites of ADDL-treated neurons containing no Tau and with normal spine density show a homogeneous distribution of mitochondria throughout the dendrite, similar to control neurons. b, Dendrites with missorted Tau display a lack of spines and strongly reduced mitochondria numbers (middle). c, Quantification of the mitochondrial density over the whole width of the dendrite reveal a net decrease in labeling intensity in missorted dendrites. Fluorescence intensities of missorted and non-missorted dendrites of equal width (mean: 2.5 μm) were measured over the whole width of the dendrite (arrows in a, b). Averaging of several dendrites reveals a negative correlation of Tau and mitochondria fluorescence intensities. Error bars, SD from n = 5–10 cells. ***p < 0.001 using Student's t test.
Figure 9.
Figure 9.
Taxol prevents ADDL-induced Tau missorting, loss of spines and loss of mitochondria. Primary hippocampal neurons 21DIV were treated with ADDLs (3 h, 5 μm) and 25 nm Taxol. a, Taxol prevents Tau missorting and spine loss, but not 12E8 staining in the dendrites of ADDL-treated neurons. b, Taxol prevents loss of mitochondria (stained with Mitotracker Deep Red). c, Quantification of fraction of missorted cells. Taxol reduces the number of cells displaying Tau missorting. Error bars, SEM from n = 3–4 experiments. **p < 0.01 versus control (one-way ANOVA with post hoc Bonferroni). d, Treatment of neurons with taxol does not affect the number of spines in these conditions. Error bars, SD from n = 10–20 cells per treatment condition. ***p < 0.001 versus control (one-way ANOVA with post hoc Bonferroni). Scale bars, 20 μm.
Figure 10.
Figure 10.
Aβ-oligomers induce elevation of intracellular calcium. Primary hippocampal neurons 21DIV were treated with ADDLs (3 h, 5 μm) or with the appropriate vehicle (Nb/DMSO 5%/0.1%). Calcium was visualized by labeling with the calcium indicator Rhod2AM/F-127. Note that calcium levels are increased in cells with Tau missorting (arrows). Missorting of Tau was identified by atypical presence of Tau in multiple processes of the same cell with dendritic morphometric characteristics. Scale bars, 20 μm.
Figure 11.
Figure 11.
Tau missorting can be induced by several types of stressors. a, Control cells (primary hippocampal neurons aged 3–4 weeks). b–f, Treatment with H2O2, 125 μm, 3 h (b), serum deprivation, 3 h (c); glutamate, 10 μm, 3 h (d); ATP, 100 μm, 3 h (e); F12, 1%, 3 h (f). In addition to Aβ, a variety of stressors can trigger Tau redistribution, phosphorylation, and loss of dendritic spines. Top, Tau staining; middle, MAP2; bottom, merged images. MAP2 antibody staining was used to identify dendritic processes. Scale bars, 20 μm. g, Quantification of the percentage of missorted neurons with different stress inducing agents as depicted. Error bars, SEM from n = 3–4 experiments.

References

    1. Ashe KH. In search of the molecular basis of memory loss in Alzheimer disease. Alzheimer Dis Assoc Disord. 2006;20:200–201. - PubMed
    1. Ballatore C, Lee VM, Trojanowski JQ. Tau-mediated neurodegeneration in Alzheimer's disease and related disorders. Nat Rev Neurosci. 2007;8:663–672. - PubMed
    1. Bernstein SL, Dupuis NF, Lazo ND, Wyttenbach T, Condron MM, Bitan G, Teplow DB, Shea JE, Ruotolo BT, Robinson CV, Bowers MT. Amyloid-Î2 protein oligomerization and the importance of tetramers and dodecamers in the aetiology of Alzheimer's disease. Nat Chem. 2009;1:326–331. - PMC - PubMed
    1. Bickar D, Reid PD. A high-affinity protein stain for Western blots, tissue prints, and electrophoretic gels. Anal Biochem. 1992;203:109–115. - PubMed
    1. Biernat J, Wu YZ, Timm T, Zheng-Fischhöfer Q, Mandelkow E, Meijer L, Mandelkow EM. Protein kinase MARK/PAR-1 is required for neurite outgrowth and establishment of neuronal polarity. Mol Biol Cell. 2002;13:4013–4028. - PMC - PubMed

Publication types

MeSH terms