. 2010 Nov;84(22):12018-29.
doi: 10.1128/JVI.01472-10. Epub 2010 Sep 8.

Fluidity of HIV-1-specific T-cell responses during acute and early subtype C HIV-1 infection and associations with early disease progression

Affiliations

Fluidity of HIV-1-specific T-cell responses during acute and early subtype C HIV-1 infection and associations with early disease progression

Mandla Mlotshwa et al. J Virol. 2010 Nov.

Abstract

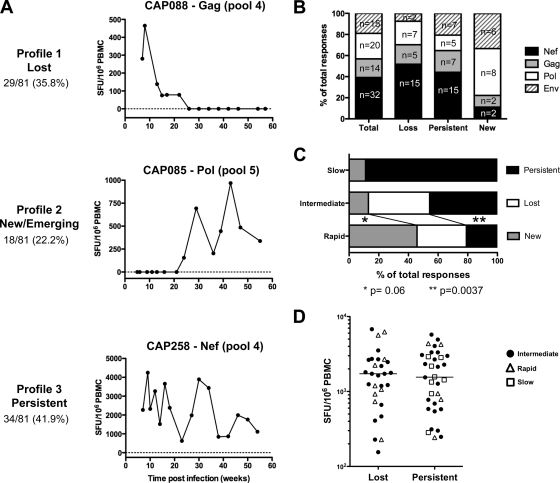
Deciphering immune events during early stages of human immunodeficiency virus type 1 (HIV-1) infection is critical for understanding the course of disease. We characterized the hierarchy of HIV-1-specific T-cell gamma interferon (IFN-γ) enzyme-linked immunospot (ELISPOT) assay responses during acute subtype C infection in 53 individuals and associated temporal patterns of responses with disease progression in the first 12 months. There was a diverse pattern of T-cell recognition across the proteome, with the recognition of Nef being immunodominant as early as 3 weeks postinfection. Over the first 6 months, we found that there was a 23% chance of an increased response to Nef for every week postinfection (P = 0.0024), followed by a nonsignificant increase to Pol (4.6%) and Gag (3.2%). Responses to Env and regulatory proteins appeared to remain stable. Three temporal patterns of HIV-specific T-cell responses could be distinguished: persistent, lost, or new. The proportion of persistent T-cell responses was significantly lower (P = 0.0037) in individuals defined as rapid progressors than in those progressing slowly and who controlled viremia. Almost 90% of lost T-cell responses were coincidental with autologous viral epitope escape. Regression analysis between the time to fixed viral escape and lost T-cell responses (r = 0.61; P = 0.019) showed a mean delay of 14 weeks after viral escape. Collectively, T-cell epitope recognition is not a static event, and temporal patterns of IFN-γ-based responses exist. This is due partly to viral sequence variation but also to the recognition of invariant viral epitopes that leads to waves of persistent T-cell immunity, which appears to associate with slower disease progression in the first year of infection.


Figures

FIG. 1.
FIG. 1.
Frequency of T-cell recognition across the expressed subtype C HIV-1 proteome. (A) Dotted lines represent response frequencies to Nef, Pol, Gag, Env, Vif, Vpr, Rev, Vpu, and Tat at 6, 12, and 24 weeks postinfection (ranges of weeks postinfection for each time point are indicated in parentheses). The two horizontal dotted lines represent cutoffs for immunodominant (>50%) and subdominant (<25%) responses. (B) Association of viral load with the magnitudes of HIV-1-specific T-cell responses across the entire expressed genome using a generalized estimating equation model. This model was fitted to the data using a binomial distribution with a logit link, adjusted for repeated measurements (with an unstructured covariance structure). The horizontal solid line represents an odds ratio of 1.
FIG. 2.
FIG. 2.
Magnitude, proportions, and hierarchy of IFN-γ ELISPOT responses. (A) Cumulative magnitudes of IFN-γ ELISPOT responses across the HIV-1 proteome, expressed as spot-forming units (SFU)/106 PBMC, at 5 (range, 3 to 8), 13 (range, 12 to 15), and 22 (range, 20 to 26) weeks postinfection. Each symbol represents a response per participant, and the solid vertical lines represent the upper and lower ranges, with the median responses as short horizontal bars. (B) Pie charts depicting the relative contributions of Nef, Gag, Pol, Env, and VVTRV (Vif, Vpr, Tat, Rev, Vpu) to the total magnitude of HIV-1-specific T-cell responses at 5 (range, 3 to 8), 13 (range, 12 to 15), and 22 (range, 20 to 26) weeks postinfection. (C) Rate of change in the magnitudes of HIV-1-specific T-cell responses across the entire expressed genome over weeks postinfection.
FIG. 3.
FIG. 3.
Longitudinal characterization of HIV-1-specific T-cell responses over the first year of infection. (A) Tracking of HIV-1 specific T-cell responses over time showing three distinct profiles of T-cell recognition; (B) proportion of IFN-γ ELISPOT responses that are lost, persistent, or new to Nef, Gag, Pol, and Env when followed longitudinally over 1 year; (C) proportion of lost, persistent, and new IFN-γ ELISPOT responses in rapid progressors (n = 10), intermediate progressors (n = 33), and slow progressors (n = 8); (D) peak magnitudes of lost or persistent IFN-γ ELISPOT responses.
FIG. 4.
FIG. 4.
Correlations between peptide pool responses and confirmed single peptides. Spearman correlations between IFN-γ ELISPOT responses derived from the peptide pool versus single confirmed peptides within the pool for Gag, Nef, Pol, and Env. The black circles represent peptide pools versus single peptides for all responses, open circles represent peptide pools versus single peptides for peptides that showed evidence for autologous viral sequence change, and crosses represent peptide pools versus single peptides for peptides that showed persistent IFN-γ ELISPOT responses.
FIG. 5.
FIG. 5.
Profiles of T-cell recognition in relation to autologous sequence variations in Gag and Nef. Representative examples of the three T-cell recognition profiles in relation to autologous sequence variation, shown as the magnitudes of IFN-γ ELISPOT responses over weeks postinfection. Each example is a representative individual within the cohort, showing the high-resolution HLA background for A, B, and C alleles. The sequences of the autologous virus at different weeks postinfection are shown underneath each graph. The gray shaded areas indicate the putative targeted epitope. The boxes with dashed borders on the graphs show the windows of time in which autologous viral escape occurred. “E” corresponds to a mutation within the target epitope, and “F” corresponds to a mutation in the flanking region of the targeted epitope.
FIG. 6.
FIG. 6.
Relationship between the time of loss of IFN-γ responses and the median time of viral escape or autologous sequence variation. Linear regression showing a linear correlation between the estimated median time of autologous epitope escape and the time of IFN-γ ELISPOT response loss. The dashed lines indicate the 95% confidence intervals (c.i.) above and below the mean regression line. The estimated time of escape was calculated as the median time between the last time point measured where the autologous sequence was wild type and the first time point where the variant sequence was detected.

References

    1. Allen, T. M., M. Altfeld, S. C. Geer, E. T. Kalife, C. Moore, K. M. O'Sullivan, I. Desouza, M. E. Feeney, R. L. Eldridge, E. L. Maier, D. E. Kaufmann, M. P. Lahaie, L. Reyor, G. Tanzi, M. N. Johnston, C. Brander, R. Draenert, J. K. Rockstroh, H. Jessen, E. S. Rosenberg, S. A. Mallal, and B. D. Walker. 2005. Selective escape from CD8+ T-cell responses represents a major driving force of human immunodeficiency virus type 1 (HIV-1) sequence diversity and reveals constraints on HIV-1 evolution. J. Virol. 79:13239-13249. - PMC - PubMed
    1. Altfeld, M., M. M. Addo, R. Shankarappa, P. K. Lee, T. M. Allen, X. G. Yu, A. Rathod, J. Harlow, K. O'Sullivan, M. N. Johnston, P. J. Goulder, J. I. Mullins, E. S. Rosenberg, C. Brander, B. Korber, and B. D. Walker. 2003. Enhanced detection of human immunodeficiency virus type 1-specific T-cell responses to highly variable regions by using peptides based on autologous virus sequences. J. Virol. 77:7330-7340. - PMC - PubMed
    1. Barouch, D. H., J. Kunstman, M. J. Kuroda, J. E. Schmitz, S. Santra, F. W. Peyerl, G. R. Krivulka, K. Beaudry, M. A. Lifton, D. A. Gorgone, D. C. Montefiori, M. G. Lewis, S. M. Wolinsky, and N. L. Letvin. 2002. Eventual AIDS vaccine failure in a rhesus monkey by viral escape from cytotoxic T lymphocytes. Nature 415:335-339. - PubMed
    1. Berger, C. T., J. M. Carlson, C. J. Brumme, K. L. Hartman, Z. L. Brumme, L. M. Henry, P. C. Rosato, A. Piechocka-Trocha, M. A. Brockman, P. R. Harrigan, D. Heckerman, D. E. Kaufmann, and C. Brander. 2010. Viral adaptation to immune selection pressure by HLA class I-restricted CTL responses targeting epitopes in HIV frameshift sequences. J. Exp. Med. 207:61-75. - PMC - PubMed
    1. Bernardin, F., D. Kong, L. Peddada, L. A. Baxter-Lowe, and E. Delwart. 2005. Human immunodeficiency virus mutations during the first month of infection are preferentially found in known cytotoxic T-lymphocyte epitopes. J. Virol. 79:11523-11528. - PMC - PubMed

Publication types