

Fancd2-/- mice have hematopoietic defects that can be partially corrected by resveratrol
- PMID: 20826722
- PMCID: PMC3012535
- DOI: 10.1182/blood-2010-04-278226
Fancd2-/- mice have hematopoietic defects that can be partially corrected by resveratrol
Abstract
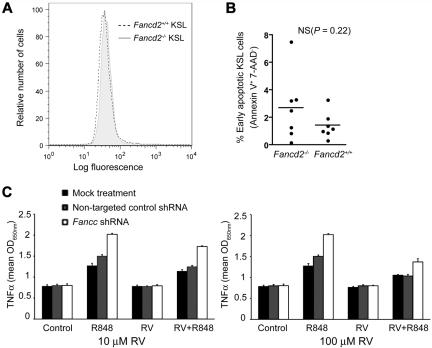
Progressive bone marrow failure is a major cause of morbidity and mortality in human Fanconi Anemia patients. In an effort to develop a Fanconi Anemia murine model to study bone marrow failure, we found that Fancd2(-/-) mice have readily measurable hematopoietic defects. Fancd2 deficiency was associated with a significant decline in the size of the c-Kit(+)Sca-1(+)Lineage(-) (KSL) pool and reduced stem cell repopulation and spleen colony-forming capacity. Fancd2(-/-) KSL cells showed an abnormal cell cycle status and loss of quiescence. In addition, the supportive function of the marrow microenvironment was compromised in Fancd2(-/-) mice. Treatment with Sirt1-mimetic and the antioxidant drug, resveratrol, maintained Fancd2(-/-) KSL cells in quiescence, improved the marrow microenvironment, partially corrected the abnormal cell cycle status, and significantly improved the spleen colony-forming capacity of Fancd2(-/-) bone marrow cells. We conclude that Fancd2(-/-) mice have readily quantifiable hematopoietic defects, and that this model is well suited for pharmacologic screening studies.
Figures


Similar articles
-
Radiologic differences between bone marrow stromal and hematopoietic progenitor cell lines from Fanconi Anemia (Fancd2(-/-)) mice.Radiat Res. 2014 Jan;181(1):76-89. doi: 10.1667/RR13405.1. Epub 2014 Jan 7. Radiat Res. 2014. PMID: 24397476 Free PMC article.
-
Evaluation of resveratrol and N-acetylcysteine for cancer chemoprevention in a Fanconi anemia murine model.Pediatr Blood Cancer. 2014 Apr;61(4):740-2. doi: 10.1002/pbc.24780. Epub 2013 Sep 20. Pediatr Blood Cancer. 2014. PMID: 24115584 Free PMC article.
-
Impairment of fetal hematopoietic stem cell function in the absence of Fancd2.Exp Hematol. 2017 Apr;48:79-86. doi: 10.1016/j.exphem.2016.11.006. Epub 2016 Dec 1. Exp Hematol. 2017. PMID: 27915139 Free PMC article.
-
Current knowledge on the pathophysiology of Fanconi anemia: from genes to phenotypes.Int J Hematol. 2001 Jul;74(1):33-41. doi: 10.1007/BF02982547. Int J Hematol. 2001. PMID: 11530803 Review.
-
FANCD2 and DNA Damage.Int J Mol Sci. 2017 Aug 19;18(8):1804. doi: 10.3390/ijms18081804. Int J Mol Sci. 2017. PMID: 28825622 Free PMC article. Review.
Cited by
-
Metformin for treatment of cytopenias in children and young adults with Fanconi anemia.Blood Adv. 2022 Jun 28;6(12):3803-3811. doi: 10.1182/bloodadvances.2021006490. Blood Adv. 2022. PMID: 35500223 Free PMC article. Clinical Trial.
-
Lnk/Sh2b3 deficiency restores hematopoietic stem cell function and genome integrity in Fancd2 deficient Fanconi anemia.Nat Commun. 2018 Sep 25;9(1):3915. doi: 10.1038/s41467-018-06380-1. Nat Commun. 2018. PMID: 30254368 Free PMC article.
-
DNA damage and repair in the hematopoietic system.Acta Biochim Biophys Sin (Shanghai). 2022 Jan 25;54(6):847-857. doi: 10.3724/abbs.2022053. Acta Biochim Biophys Sin (Shanghai). 2022. PMID: 35593466 Free PMC article. Review.
-
Resveratrol counteracts bone loss via mitofilin-mediated osteogenic improvement of mesenchymal stem cells in senescence-accelerated mice.Theranostics. 2018 Mar 23;8(9):2387-2406. doi: 10.7150/thno.23620. eCollection 2018. Theranostics. 2018. PMID: 29721087 Free PMC article.
-
Monoubiquitinated Fanconi anemia D2 (FANCD2-Ub) is required for BCR-ABL1 kinase-induced leukemogenesis.Leukemia. 2011 Aug;25(8):1259-67. doi: 10.1038/leu.2011.91. Epub 2011 Apr 26. Leukemia. 2011. PMID: 21519342 Free PMC article.
References
-
- Wang W. Emergence of a DNA-damage response network consisting of Fanconi anaemia and BRCA proteins. Nat Rev Genet. 2007;8(10):735–748. - PubMed
-
- Kutler DI, Singh B, Satagopan J, et al. A 20-year perspective on the International Fanconi Anemia Registry (IFAR). Blood. 2003;101(4):1249–1256. - PubMed
-
- Rossi DJ, Bryder D, Seita J, Nussenzweig A, Hoeijmakers J, Weissman IL. Deficiencies in DNA damage repair limit the function of haematopoietic stem cells with age. Nature. 2007;447(7145):725–729. - PubMed
Publication types
MeSH terms
Substances
Grants and funding
LinkOut - more resources
Full Text Sources
Other Literature Sources
Molecular Biology Databases
Research Materials
Miscellaneous
