Review
. 2010 Sep 22;102(18):1388-97.
doi: 10.1093/jnci/djq310. Epub 2010 Sep 8.

Improved endpoints for cancer immunotherapy trials

Affiliations
Review

Improved endpoints for cancer immunotherapy trials

Axel Hoos et al. J Natl Cancer Inst. .

Abstract

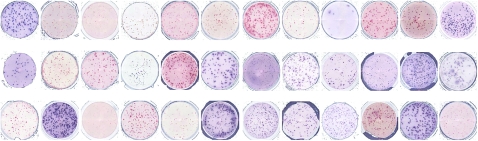
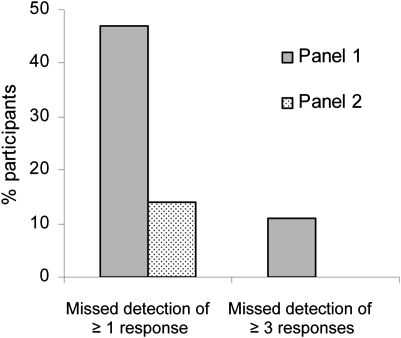
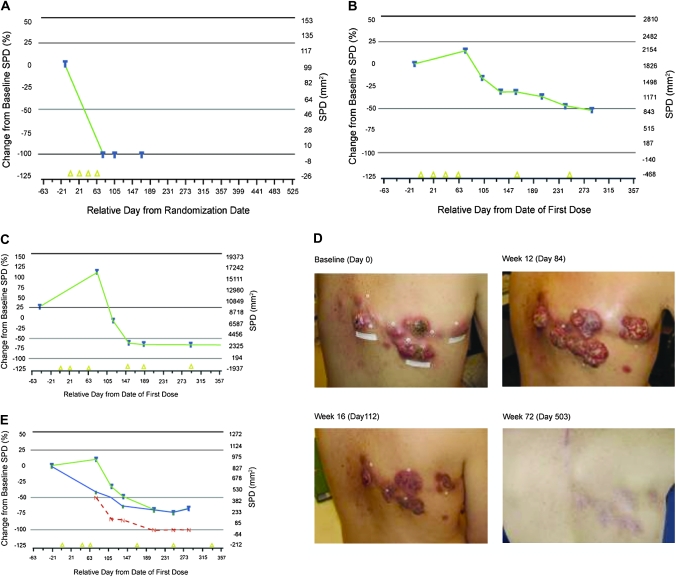
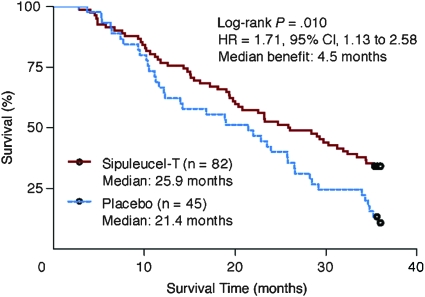
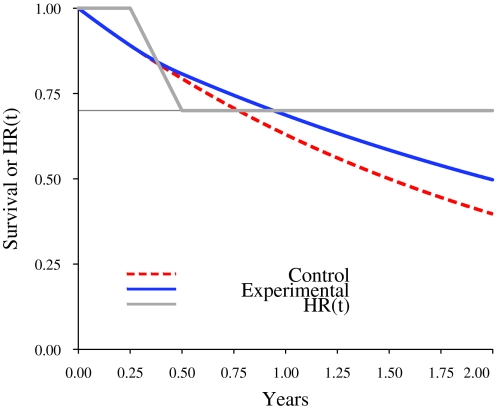
Unlike chemotherapy, which acts directly on the tumor, cancer immunotherapies exert their effects on the immune system and demonstrate new kinetics that involve building a cellular immune response, followed by changes in tumor burden or patient survival. Thus, adequate design and evaluation of some immunotherapy clinical trials require a new development paradigm that includes reconsideration of established endpoints. Between 2004 and 2009, several initiatives facilitated by the Cancer Immunotherapy Consortium of the Cancer Research Institute and partner organizations systematically evaluated an immunotherapy-focused clinical development paradigm and created the principles for redefining trial endpoints. On this basis, a body of clinical and laboratory data was generated that supports three novel endpoint recommendations. First, cellular immune response assays generate highly variable results. Assay harmonization in multicenter trials may minimize variability and help to establish cellular immune response as a reproducible biomarker, thus allowing investigation of its relationship with clinical outcomes. Second, immunotherapy may induce novel patterns of antitumor response not captured by Response Evaluation Criteria in Solid Tumors or World Health Organization criteria. New immune-related response criteria were defined to more comprehensively capture all response patterns. Third, delayed separation of Kaplan-Meier curves in randomized immunotherapy trials can affect results. Altered statistical models describing hazard ratios as a function of time and recognizing differences before and after separation of curves may allow improved planning of phase III trials. These recommendations may improve our tools for cancer immunotherapy trials and may offer a more realistic and useful model for clinical investigation.


Figures

Figure 1
Figure 1
High variability of results for the enzyme-linked immunosorbent spot (ELISPOT) immune response assay. Identical peripheral blood mononuclear cell samples from the same patient were sent to 36 different laboratories experienced with ELISPOT methodology. The image shows the spot count results in microtiter plates in which each well represents the result of one laboratory. Some wells show high numbers of spots, whereas others are low or negative. Each spot in this assay represents a single T-cell capable of reacting against a defined target antigen. These results reflect the outcome of the first ELISPOT proficiency panel, which identified sources of variability among laboratories.
Figure 2
Figure 2
Effect of assay harmonization on data variability of the enzyme-linked immunosorbent spot (ELISPOT) assay. In the Cancer Immunotherapy Consortium of the Cancer Research Institute ELISPOT proficiency panel, participating laboratories reported the response status from eight different donor–antigen combinations. Grey bars represent the first panel round and stippled bars the second panel round. In the first panel round, 47% of panelists missed detection of at least one response correctly, and 11% of panelists failed to detect at least three responses correctly (characterized as an “outlier” because of high variability). Based on the first panel results, harmonization criteria were given to panelists, and the testing was repeated in the second panel (stippled bars). ELISPOT performance improved, with only 14% of panelists missing at least one responder and zero outliers.
Figure 3
Figure 3
Clinical response patterns observed with anti-cytotoxic T lymphocyte–associated protein 4 immunotherapy (ipilimumab). Immunotherapy patterns of response depicted as a continuous variable of relative change of tumor burden (%) over time. Tumor burden is described through the sum of the perpendicular diameters (SPD) of all measurable lesions (baseline and new) at each time point. A and B) Conventional response patterns: (A) immediate response; (B) durable stable disease with possible slow decline in tumor burden. C and E) Novel immunotherapy response patterns: (C) increase in total tumor burden followed by response. (D) Clinical images corresponding to pattern (C): tumor burden on the skin at baseline (day 0) is increased at first follow-up (day 84) and subsequently declines (day 112) to a complete response (day 503) (courtesy of Dr K. Harmankaya). E) The second novel pattern shows a response in the presence of new lesions; existing lesions present at baseline (blue) and new lesions (red) are added to define the total tumor burden (green). Despite new lesions, the total tumor burden is still declining to a partial response. Yellow triangles indicate dosing with immunotherapy; horizontal lines indicate standard thresholds for response or progression. Modified after Wolchok et al. (43).
Figure 4
Figure 4
Delayed separation of survival curves of sipuleucel-T immunotherapy vs placebo in advanced prostate cancer, where the separation of Kaplan–Meier curves occurred after approximately 8 months after random assignment. HR = hazard ratio; CI = confidence interval. Courtesy of Small et al. (12). Reprinted with permission. Copyright 2008 American Society of Clinical Oncology. All rights reserved.
Figure 5
Figure 5
Mathematical illustration of a delayed separation of curves. Example of a two-arm study with an ultimate hazard ratio of 0.7. The control arm has an exponential survival distribution with median survival of 18 months (red dashed curve). The form of the delayed separation is specified by a hazard ratio function (HR(t), solid gray line) that has the value 1.0 for 3 months and then decreases linearly between 3 and 6 months to become 0.7 at 6 months and then remains constant. The experimental arm survival distribution (solid blue line) is the consequence of mathematically blending the control arm survival distribution function and the hazard ratio function.

Comment in

  • The hazards of endpoints.
    Berry DA. Berry DA. J Natl Cancer Inst. 2010 Sep 22;102(18):1376-7. doi: 10.1093/jnci/djq334. Epub 2010 Sep 8. J Natl Cancer Inst. 2010. PMID: 20826734 No abstract available.

References

    1. Finke LH, Wentworth K, Blumenstein B, et al. Lessons from randomized phase III studies with active cancer immunotherapies—outcomes from the 2006 meeting of the Cancer Vaccine Consortium (CVC) Vaccine. 2007;25(suppl 2):B97–B109. - PubMed
    1. Copier J, Dalgleish AG, Britten CM, et al. Improving the efficacy of cancer immunotherapy. Eur J Cancer. 2009;45(8):1424–1431. - PubMed
    1. Rosenberg SA, Yang JC, Restifo NP. Cancer immunotherapy: moving beyond current vaccines. Nat Med. 2004;10(9):909–915. - PMC - PubMed
    1. Finn OJ. Cancer immunology. N Engl J Med. 2008;358(25):2704–2715. - PubMed
    1. Melero I, Hervas-Stubbs S, Glennie M, et al. Immunostimulatory monoclonal antibodies for cancer therapy. Nat Rev Cancer. 2007;7(2):95–106. - PubMed

Publication types