. 2010 Nov 5;285(45):34608-15.
doi: 10.1074/jbc.M110.166710. Epub 2010 Sep 7.

Stable interaction between the human proliferating cell nuclear antigen loader complex Ctf18-replication factor C (RFC) and DNA polymerase {epsilon} is mediated by the cohesion-specific subunits, Ctf18, Dcc1, and Ctf8

Affiliations

Stable interaction between the human proliferating cell nuclear antigen loader complex Ctf18-replication factor C (RFC) and DNA polymerase {epsilon} is mediated by the cohesion-specific subunits, Ctf18, Dcc1, and Ctf8

Takeshi Murakami et al. J Biol Chem. .

Abstract

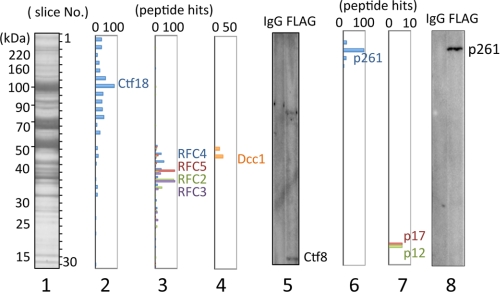
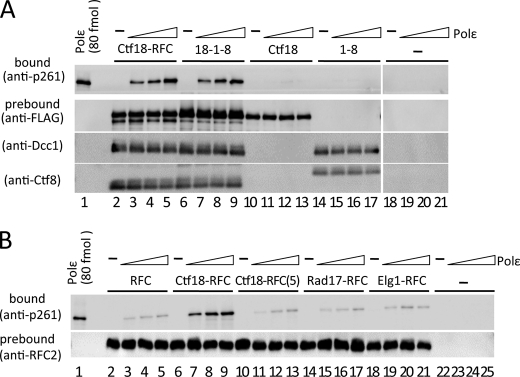
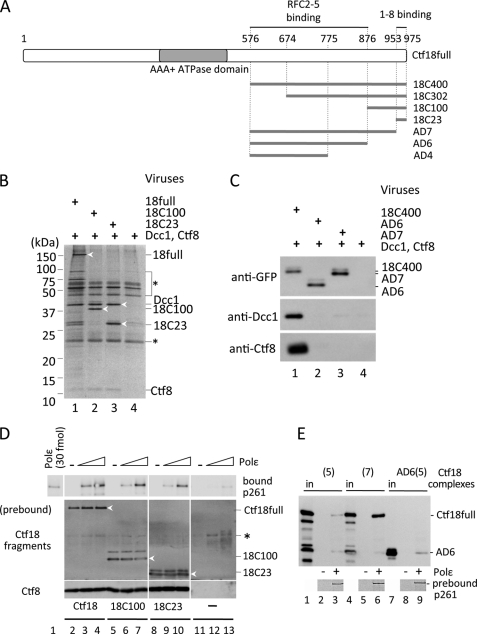
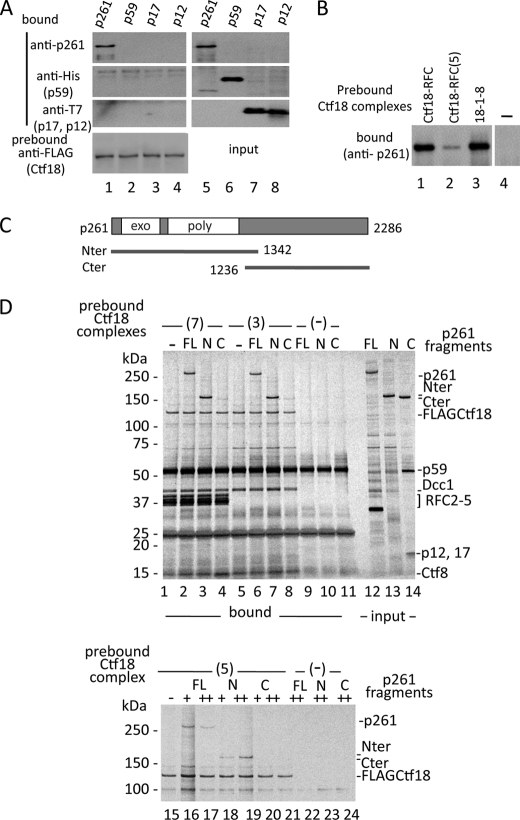
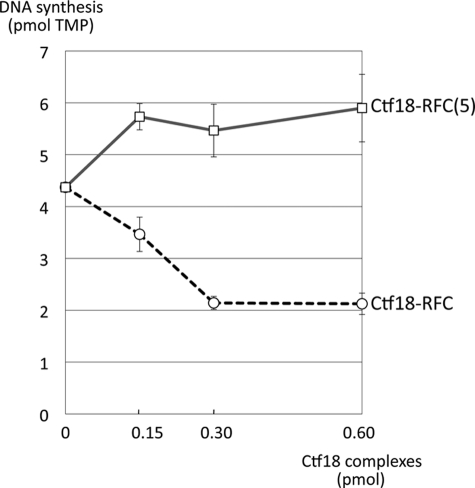
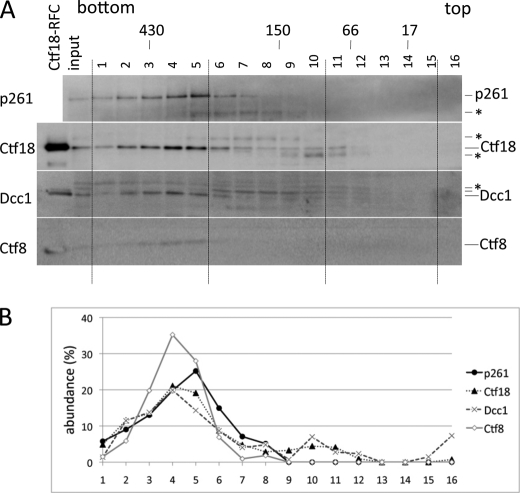
One of the proliferating cell nuclear antigen loader complexes, Ctf18-replication factor C (RFC), is involved in sister chromatid cohesion. To examine its relationship with factors involved in DNA replication, we performed a proteomics analysis of Ctf18-interacting proteins. We found that Ctf18 interacts with a replicative DNA polymerase, DNA polymerase ε (pol ε). Co-immunoprecipitation with recombinant Ctf18-RFC and pol ε demonstrated that their binding is direct and mediated by two distinct interactions, one weak and one stable. Three subunits that are specifically required for cohesion in yeast, Ctf18, Dcc1, and Ctf8, formed a trimeric complex (18-1-8) and together enabled stable binding with pol ε. The C-terminal 23-amino acid stretch of Ctf18 was necessary for the trimeric association of 18-1-8 and was required for the stable interaction. The weak interaction was observed with alternative loader complexes including Ctf18-RFC(5), which lacks Dcc1 and Ctf8, suggesting that the common loader structures, including the RFC small subunits (RFC2-5), are responsible for the weak interaction. The two interaction modes, mediated through distinguishable structures of Ctf18-RFC, both occurred through the N-terminal half of pol ε, which includes the catalytic domain. The addition of Ctf18-RFC or Ctf18-RFC(5) to the DNA synthesis reaction caused partial inhibition and stimulation, respectively. Thus, Ctf18-RFC has multiple interactions with pol ε that promote polymorphic modulation of DNA synthesis. We propose that their interaction alters the DNA synthesis mode to enable the replication fork to cooperate with the establishment of cohesion.


Figures

FIGURE 1.
FIGURE 1.
Analyses of Ctf18-interacting proteins from lysates of 293 cells expressing FLAG-Ctf18. Proteins co-eluted with FLAG-Ctf18 from an anti-FLAG column were separated in a 7.5–17.5% SDS-acrylamide gel followed by Coomassie Brilliant Blue staining (lane 1). The gel was sliced into 30 pieces (numbered from top to bottom as indicated in lane 1), and included proteins were identified by LC/MS/MS analysis. Panels 2, 3, 4, 6, and 7 indicate hit numbers of detected peptides for Ctf18, RFC2–5, Dcc1, pol ϵ p261, and p17/p12, respectively. Comparable immunoblotting of Ctf8 (panel 5) and p261 (panel 8) with eluates from control IgG-Sepharose (IgG) and from the anti-FLAG column (FLAG) are shown in each panel. In addition to the Ctf8-specific band, a background band appears in lane 5 in the high molecular mass area.
FIGURE 2.
FIGURE 2.
Co-immunoprecipitation of pol ϵ with loader complexes. A, approximately 0.7 pmol of Ctf18-RFC (lanes 2–5), 18-1-8 (lanes 6–9), Ctf18 (lanes 10–13), and 1-8 (with FLAG-Ctf8, lanes 14–17) prebound to anti-FLAG beads was co-immunoprecipitated with 0 (−), 0.2, 0.4, and 0.6 pmol (triangles) of pol ϵ in 10-μl reaction mixtures. Lanes 18–21 are the negative control without Ctf18 complexes. Input pol ϵ (80 fmol) was applied as the loading standard (lane 1). One-fifth of each precipitate was analyzed by immunoblotting with an anti-p261 monoclonal antibody (top panels). Prebound proteins (FLAG-Ctf18, Dcc1, and Ctf8 or FLAG-Ctf8) were compared by immunoblotting. B, 0.7 pmol of RFC (lanes 2–5), Ctf18-RFC (lanes 6–9), Ctf18-RFC(5) (lanes 10–13), Rad17-RFC (lanes 14–17), and Elg1-RFC (lanes 18–21) prebound to anti-FLAG beads was incubated with increasing amounts of pol ϵ and analyzed by immunoblotting as in A. Lanes 22–25 are the negative control without loaders. Immunoblotting of RFC2 shows the uniformity of the bound loader proteins.
FIGURE 3.
FIGURE 3.
C-terminal region of Ctf18 required for association with 1-8 and the stable interaction with pol ϵ. A, truncated Ctf18 fragments associated with RFC2–5 and 1-8. Full-length Ctf18 (Ctf18full; residues 1–975) with the AAA+ ATPase domain (gray) and its truncated fragments, 18C400, 18C302, 18C100, and 18C23 carrying 400, 302, 100, and 23 residues from the C terminus, respectively, and 200-, 100-, and 23-residue C-terminal deletions from 18C400 (AD4, -6, -7) are indicated. These fragments were tagged with GFP at their N termini. The Ctf18 regions necessary for interactions with RFC2–5 and 1-8 are indicated above the map (see supplemental. Fig. 2). B and C, association of Ctf18 fragments with 1-8. GFP-tagged Ctf18 fragments 18full, 18C100, and 18C23 (B, lanes 1–3), or 18C400, AD6, and AD7 (C, lanes 1–3) were co-expressed with Dcc1 and Ctf8 in insect cells and precipitated with anti-GFP beads. Lane 4 in each panel is the negative control without GFP-Ctf18 fragments. The bound fractions were separated in 4–20% or 12.5% polyacrylamide gels and analyzed by silver staining (B) or immunoblotting with the indicated antibodies (C). Protein bands for analyses are indicated at the right of the panels and with white arrowheads in B. A bracket and a line with an asterisk (*) in B show nonspecific proteins or IgG chains from anti-GFP beads. D, interaction of pol ϵ with 18-1-8 (lanes 2–4), 18C100-1-8 (lanes 5–7), or 18C23-1-8 (lanes 8–10) is shown. Approximately 0.7 pmol of trimeric complexes were prebound to anti-FLAG beads and incubated with 0 (−), 0.2, or 0.6 pmol of pol ϵ (triangles). The bound proteins were analyzed by immunoblotting with anti-p261 (top), anti-Ctf18 (middle), or anti-Ctf8 (bottom) antibodies. Three Ctf18 fragments are indicated with white arrowheads. Lanes 11–13 are the control experiments without Ctf18 fragments, and an asterisk (*) indicates a nonspecific band. E, co-immunoprecipitation of Ctf18 complexes with Ni-nitrilotriacetic acid magnetic beads prebound with pol ϵ complex is indicated in the bottom panels (lanes 3, 6, and 9). Sf9 lysates expressing roughly equal amounts of GFP-tagged Ctf18-RFC(5) ((5) lanes 1–3), Ctf18-RFC ((7) lanes 4–6), or AD6-RFC2–5 (AD6(5) lanes 7–9) were mixed with the beads, and proteins in the 50% bound fractions were detected with an anti-GFP antibody. Lanes 1, 4, and 7 are 5% input controls of the respective fragments, and lanes 2, 5, and 8 are negative controls without pol ϵ. Lower bands in lanes 1 and 4 are degradation products of GFP-Ctf18.
FIGURE 4.
FIGURE 4.
N-terminal half of pol ϵ p261 interacts with Ctf18-RFC. A, pol ϵ subunits (p261, His-tagged p59, T7-tagged p17, and T7-tagged p12; 1.4 pmol each) incubated with anti-FLAG beads prebound with 1.8 pmol of Ctf18-RFC (lanes 1–4). One-third of the bound samples was used for immunoblotting with the indicated antibodies. Lanes 5–8 are the input controls (one-tenth of the total samples). B, binding of p261 with Ctf18 subcomplexes. 1 pmol of p261 was incubated with anti-FLAG beads prebound with 0.8 pmol of Ctf18-RFC (lane 1), Ctf18-RFC(5) (lane 2), or 18-1-8 (lane 3), and bound p261 was detected with an anti-p261 antibody. Lane 4 is the control without Ctf18 complexes. C, schematic of p261, including the exonuclease (exo) and DNA polymerase (poly) regions. The N- and C-terminal fragments (Nter and Cter) are indicated. Numbers represent the length of p261 in residues and the ends of Nter and Cter. D, upper panel, binding of p261 full-length (FL; lanes 2, 6, and 9), Nter (N; lanes 3, 7, and 10), and Cter (C; lanes 4, 8, and 11) with Ctf18-RFC ((7) lanes 1–4) or 18-1-8 ((3) lanes 5–8) in a pulldown assay with anti-FLAG antibody beads. Lanes 1, 5, and 9–11 are negative controls without p261 fragments or Ctf18 complexes (−). Partially purified p261, Nter, and Cter (1 pmol each) were mixed with beads prebound with about 0.5 pmol of Ctf18-RFC or 18-1-8, and 50% of the bound fractions were used for silver staining after 4–20% SDS-PAGE. Lanes 12–14 are 6% of the input as a control. A prominent band of about 35 kDa in lane 12 is a degradation product from p261. Cter was complexed with the p59, p17, and p12 subunits. These subunits were coexpressed in the insect cells to facilitate solubility of Cter in the lysate. Lower panel, same experiment with Ctf18-RFC(5). 0 (−), 0.5 (+), or 1 pmol (++) of p261 fragments were mixed with beads prebound with 0 (lanes 22–24) or 0.5 pmol (lanes 15–21) of Ctf18-RFC(5), and 50% of the bound fractions were analyzed as above. Lane 16 has slightly more sample than the others judging from the recovered FLAG-Ctf18. Only the upper half of the gel image is shown.
FIGURE 5.
FIGURE 5.
Effect of Ctf18-RFC and Ctf18-RFC(5) on the DNA synthesis activity of Nter. Purified Nter (0.1 pmol) was incubated with poly(dA)·oligo(dT) and [α-32P]TTP in the presence of 0.15, 0.3, or 0.6 pmol of Ctf18-RFC or Ctf18-RFC(5) at 37 °C for 30 min. The mean of two independent results of incorporated TMP are shown.
FIGURE 6.
FIGURE 6.
Fractionation of HeLa lysate by glycerol gradient sedimentation. A, HeLa lysate was fractionated by glycerol gradient sedimentation in 2.2 ml of 15–35% glycerol gradient in buffer H containing 0.1 m NaCl. Proteins were fractionated into 16 tubes, separated in a 15% acrylamide gel, and analyzed by immunoblotting with antibodies against pol ϵ p261, Ctf18, Dcc1, or Ctf8. Sedimentation positions of marker proteins with their molecular masses are shown at top. *, nonspecific proteins. B, abundances of four proteins in the fractions are indicated as percent of band intensities (band intensity/sum of band intensities ×100).

Similar articles

Cited by

References

    1. Kim J., MacNeill S. A. (2003) Curr. Biol. 13, R873–R875 - PubMed
    1. Majka J., Burgers P. M. (2004) Prog. Nucleic Acids Res. Mol. Biol. 78, 227–260 - PubMed
    1. Bermudez V. P., Lindsey-Boltz L. A., Cesare A. J., Maniwa Y., Griffth J. D., Hurwitz J., Sancar A. (2003) Proc. Natl. Acad. Sci. U.S.A. 100, 1633–1638 - PMC - PubMed
    1. Ellison V., Stillman B. (2003) PLoS Biol 1, 231–243 - PMC - PubMed
    1. Mayer M. L., Gygi S. P., Aebersold R., Hieter P. (2001) Mol. Cell 7, 959–970 - PubMed

Publication types

MeSH terms