. 2010 Nov 12;285(46):35694-705.
doi: 10.1074/jbc.M110.143503. Epub 2010 Sep 8.

Biochemical characterization of the transcriptional regulator BzdR from Azoarcus sp. CIB

Affiliations

Biochemical characterization of the transcriptional regulator BzdR from Azoarcus sp. CIB

Gonzalo Durante-Rodríguez et al. J Biol Chem. .

Abstract

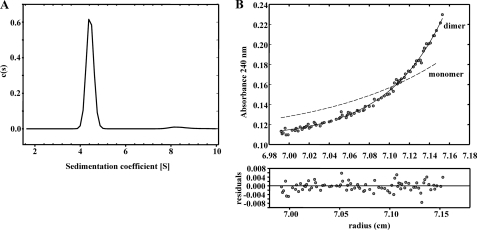
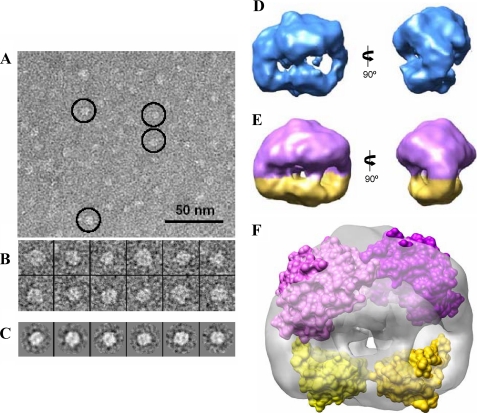
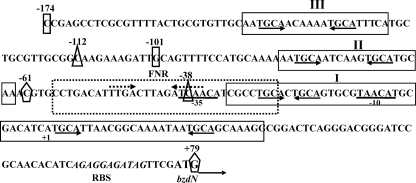
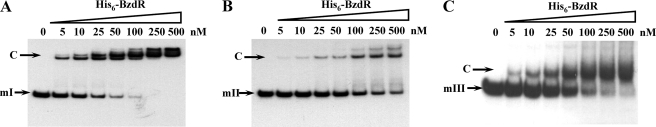
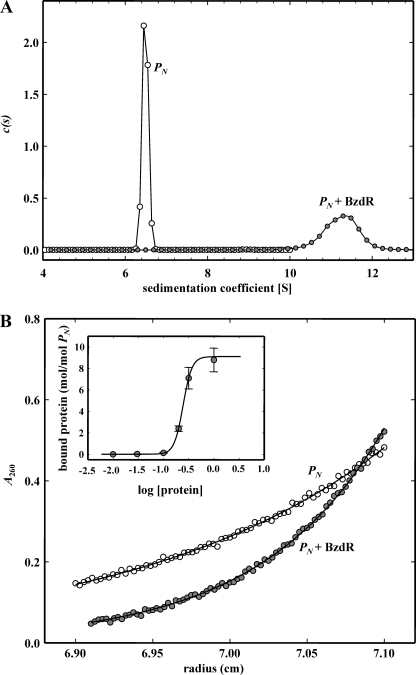
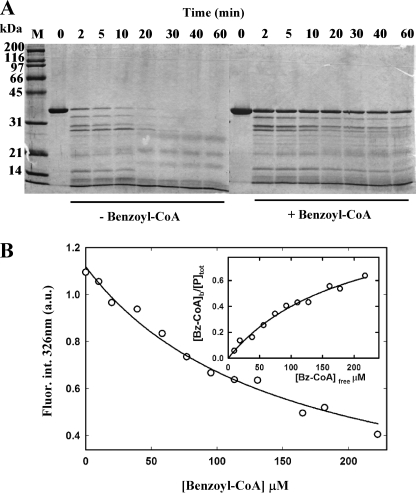
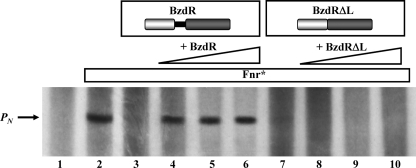
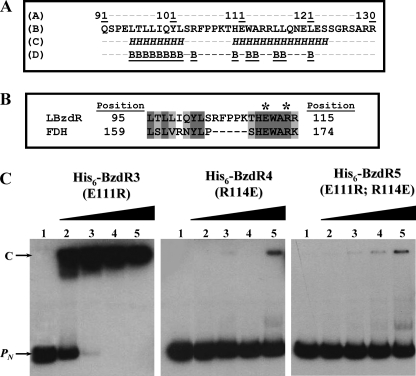
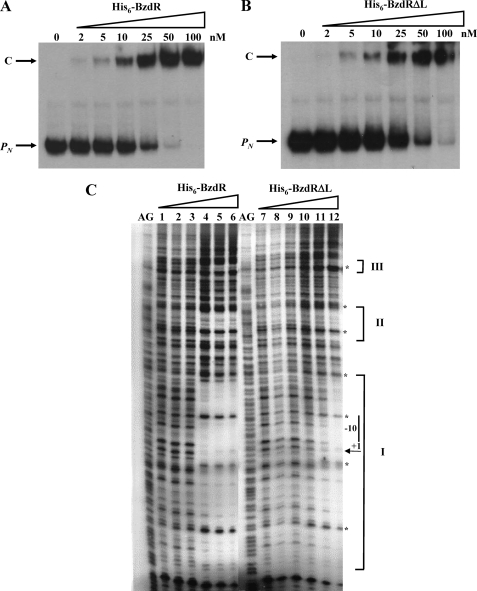
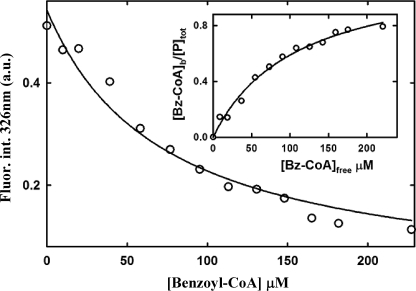
The BzdR transcriptional regulator that controls the P(N) promoter responsible for the anaerobic catabolism of benzoate in Azoarcus sp. CIB constitutes the prototype of a new subfamily of transcriptional regulators. Here, we provide some insights about the functional-structural relationships of the BzdR protein. Analytical ultracentrifugation studies revealed that BzdR is homodimeric in solution. An electron microscopy three-dimensional reconstruction of the BzdR dimer has been obtained, and the predicted structures of the respective N- and C-terminal domains of each BzdR monomer could be fitted into such a reconstruction. Gel retardation and ultracentrifugation experiments have shown that the binding of BzdR to its cognate promoter is cooperative. Different biochemical approaches revealed that the effector molecule benzoyl-CoA induces conformational changes in BzdR without affecting its oligomeric state. The BzdR-dependent inhibition of the P(N) promoter and its activation in the presence of benzoyl-CoA have been established by in vitro transcription assays. The monomeric BzdR4 and BzdR5 mutant regulators revealed that dimerization of BzdR is essential for DNA binding. Remarkably, a BzdRΔL protein lacking the linker region connecting the N- and C-terminal domains of BzdR is also dimeric and behaves as a super-repressor of the P(N) promoter. These data suggest that the linker region of BzdR is not essential for protein dimerization, but rather it is required to transfer the conformational changes induced by the benzoyl-CoA to the DNA binding domain leading to the release of the repressor. A model of action of the BzdR regulator has been proposed.


Figures

FIGURE 1.
FIGURE 1.
Study of the oligomerization state of the BzdR protein in solution. A, sedimentation coefficient distribution c(s) corresponding to the sedimentation velocity of purified His6-BzdR. The distribution pattern of concentration of the protein (c(s)) is represented in front of the sedimentation coefficient (S). B, sedimentation equilibrium data (gray dots) and the best fit analysis assuming a theoretical protein dimer (solid line) and monomer (broken line) species. The lower panel shows residuals between estimated values and experimental data for protein dimer.
FIGURE 2.
FIGURE 2.
Three-dimensional structure of BzdR using negative staining electron microscopy. A, electron microscopy field of purified His6-BzdR protein. Some representative molecules have been highlighted within circles. Scale bar, 50 nm. B, gallery of 12 selected molecules from the data set of 5,741 molecules. C, some reference-free class averages obtained using XMIPP (38). D, two views of the three-dimensional structure of BzdR reconstructed without assuming any symmetry. E, two views of the three-dimensional structure of BzdR reconstructed after imposing 2-fold symmetry. The big (violet) and the small (yellow) domains might correspond to the C-BzdR and N-BzdR domains, respectively. F, two copies of the structural models of C-BzdR (violet) and N-BzdR (yellow) can be fitted into the three-dimensional structure obtained by electron microscopy (shown as a gray transparent density), indicating that BzdR has sufficient volume to accommodate two copies of each domain. The precise orientation of the domains cannot be determined at the resolution of this three-dimensional map, and the two atomic models have been represented as a surface just to reveal the occupancy of the EM density.
FIGURE 3.
FIGURE 3.
Scheme of the PN promoter from Azoarcus sp. CIB. The nucleotide sequence from positions −174 to +79 is presented. The transcription start site (+1) and the inferred −10 and −35 boxes of the PN promoter are indicated. The ribosome-binding site (RBS) and the ATG start codon of the bzdN gene are also shown in italic and boldface type, respectively. The BzdR-binding regions I–III (operators) are boxed. The palindromic regions containing the TGCA repeats within the operator regions are marked with arrows below the sequence. The FNR (AcpR)-binding site (FNR) is boxed with broken lines, and the inverted repeats of the consensus FNR-binding sequence are marked with convergent broken arrows above the sequence. The ends of the mI (−61 to +79), mII (−112 to −38), and mIII (−174 to −101) DNA probes are indicated as pentagons, triangles, and rectangles, respectively.
FIGURE 4.
FIGURE 4.
In vitro binding of His6-BzdR to the mI, mII, and mIII probes. Gel retardation analyses of mI (A), mII (B), and mIII (C) were performed as indicated under “Experimental Procedures.” The concentration of purified His6-BzdR used is indicated on the top. The free DNA probes (mI, mII, or mIII) and the protein-DNA complexes (C) are indicated by arrows.
FIGURE 5.
FIGURE 5.
Analysis of complex formation in the interaction of protein His6-BzdR with DNA 253-bp-PN. A, sedimentation coefficient distribution c(s) corresponding to the sedimentation velocity of purified DNA (open circles) and protein-DNA complex (closed circles) at a protein/DNA molar ratio of 10:1. B, corresponding sedimentation equilibrium gradients. Inset represents the variation of bound protein (mol/mol DNA) with protein concentration.
FIGURE 6.
FIGURE 6.
Conformational change of BzdR induced by benzoyl-CoA. A, limited proteolysis assays of purified His6-BzdR. SDS-12.5% PAGE show the results of the trypsin-mediated digestion of purified His6-BzdR (10 μm) in the absence (−Benzoyl-CoA) or in the presence (+Benzoyl-CoA) of 2 mm benzoyl-CoA as detailed under “Experimental Procedures.” Bz, benzoyl. Lanes 0–60, incubations were performed at 37 °C for 0, 2, 5, 10, 20, 30, 40, 60 min, respectively. Lane M represents the molecular mass markers (in kDa). B, intrinsic fluorescence of BzdR as a function of benzoyl-CoA concentration. Data points represent the decrease of the BzdR (7.5 μm) fluorescence emission maximum (326 nm) expressed in arbitrary units (a.u.) upon excitation at 275 nm in the presence of increasing concentrations of benzoyl-CoA. Inset, fitting of benzoyl-CoA binding to BzdR to a single site model.
FIGURE 7.
FIGURE 7.
Effect of BzdR or BzdRΔL and benzoyl-CoA on in vitro transcription from PN. Multiple round in vitro transcription reactions were performed as indicated under “Experimental Procedures” by using pJCD-PN, a plasmid template that produces a 184-nucleotide mRNAs from PN, 50 nm E. coli RNA polymerase, and 20 nm Fnr* activator. The transcription reactions were carried out in the absence of repressor (lane 2) or in the presence of 25 nm (lanes 3 and 4), 50 nm (lane 5), or 100 nm (lane 6) of purified His6-BzdR or 25 nm (lanes 7 and 8), 50 nm (lane 9), or 100 nm (lane 10) of purified His6-BzdRΔL. Benzoyl-CoA was added at 1 mm (lanes 4–6 and 8–10). Lane 1, control assay without RNA polymerase.
FIGURE 8.
FIGURE 8.
Analysis of the linker region of BzdR. A, amino acid sequence analysis of LBzdR. The position of the LBzdR residues in the primary structure of BzdR is indicated. The sequence of the linker was analyzed using the JPred3 program that predicts residues involved in α-helices, indicated as italic H, and those that have a probability lower than 25% of being located at the protein surface, indicated as underlined B. B, alignment of a region of LBzdR (residues 95–115) with a significantly similar region (residues 159–174) of the formate dehydrogenase from Pseudomonas sp. 101. The dark gray and light gray shadows represent identical residues and conservative substitutions, respectively. The position of the Glu and Arg residues involved in a saline bridge in formate dehydrogenase and the equivalent residues in LBzdR are indicated with an asterisk. C, in vitro analysis of the interaction of BzdR mutants with the PN promoter. Gel retardation analysis of His6-BzdR3, His6-BzdR4, and His6-BzdR5 mutant regulators binding to the PN promoter was performed as indicated in “Experimental Procedures.” Lane 1, free PN probe; lanes 2–5, retardation assays containing 25, 50, 100, or 200 nm, respectively, of purified protein (indicated on the top). The PN probe (PN) and the PN-protein complex (C) are indicated by arrows.
FIGURE 9.
FIGURE 9.
In vitro binding of His6-BzdR and His6-BzdRΔL to the PN probe. A and B, gel retardation analyses of PN were performed as indicated under “Experimental Procedures.” The concentration of purified His6-BzdR (A) and His6-BzdRΔL (B) used is indicated on the top. The free DNA probes (PN) and the protein-DNA complexes (C) are indicated by arrows. C, DNase I footprinting analyses of the interaction of purified His6-BzdR and His6-BzdRΔL with the PN promoter region. The DNase I footprinting experiments were carried out using the PN probe labeled as indicated under “Experimental Procedures.” Lanes 1 and 7 show footprinting assays in the absence of His6-BzdR or His6-BzdRΔL. Lanes 2–6 show footprinting assays containing 5, 25, 200, 400, and 800 nm purified His6-BzdR, respectively. Lanes 8–12 show footprinting assays containing 5, 25, 200, 400, and 800 nm purified His6-BzdRΔL, respectively. Lanes AG show the A + G Maxam and Gilbert sequencing reaction. Protected regions (I, II, and III) are marked by brackets, and the phosphodiester bonds hypersensitive to DNaseI cleavage are indicated by asterisks. The −10 box and the transcription initiation site (+1) of the PN promoter are also shown.
FIGURE 10.
FIGURE 10.
Fluorescence titration of benzoyl-CoA binding to BzdRΔL. Variation of the fluorescence intensity (Fluor.int.) of BzdRΔL at 326 nm upon excitation at 275 nm expressed in arbitrary units (a.u.), with increasing concentrations of benzoyl-CoA (Bz-CoA). Experimental data were fitted by nonlinear regression to a single hyperbolic decay curve. The inset graph shows the fitting of the latter data to an equation corresponding to a one-site saturation model (see “Experimental Procedures”).

References

    1. Gibson J. S., Harwood C. (2002) Annu. Rev. Microbiol. 56, 345–369 - PubMed
    1. Lovley D. R. (2003) Nat. Rev. Microbiol. 1, 35–44 - PubMed
    1. Carmona M., Zamarro M. T., Blázquez B., Durante-Rodríguez G., Juárez J. F., Valderrama J. A., Barragán M. J., García J. L., Díaz E. (2009) Microbiol. Mol. Biol. Rev. 73, 71–133 - PMC - PubMed
    1. Harwood C. S., Burchhardt G., Herrmann H., Fuchs G. (1999) FEMS Microbiol. Rev. 22, 439–458
    1. López Barragán M. J., Carmona M., Zamarro M. T., Thiele B., Boll M., Fuchs G., García J. L., Díaz E. (2004) J. Bacteriol. 186, 5762–5774 - PMC - PubMed

Publication types

MeSH terms

LinkOut - more resources