. 2010 Nov 5;285(45):35224-37.
doi: 10.1074/jbc.M110.165860. Epub 2010 Sep 8.

The dithiol glutaredoxins of african trypanosomes have distinct roles and are closely linked to the unique trypanothione metabolism

Affiliations

The dithiol glutaredoxins of african trypanosomes have distinct roles and are closely linked to the unique trypanothione metabolism

Sevgi Ceylan et al. J Biol Chem. .

Abstract

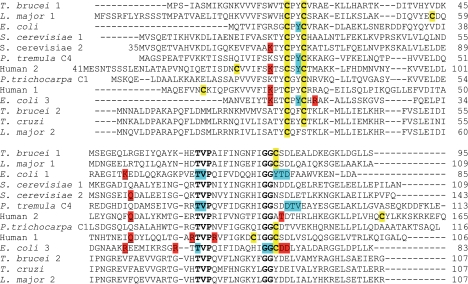
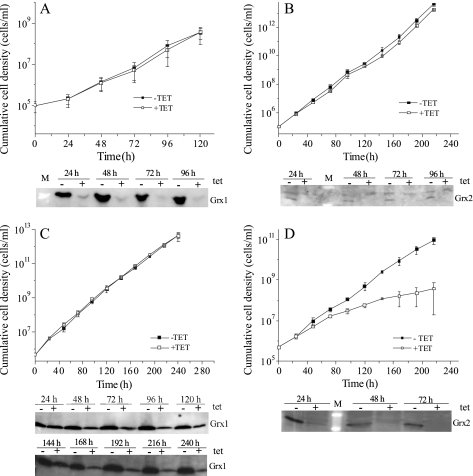
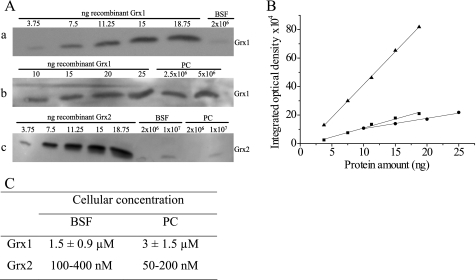
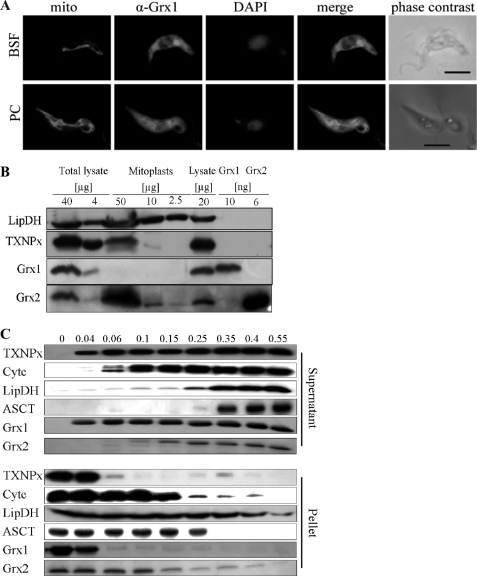
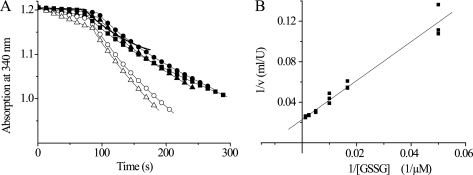
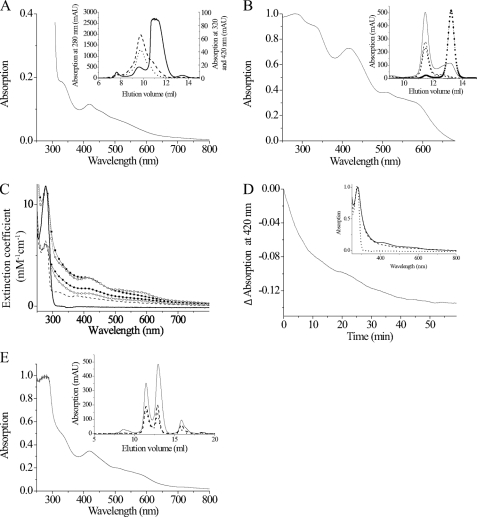
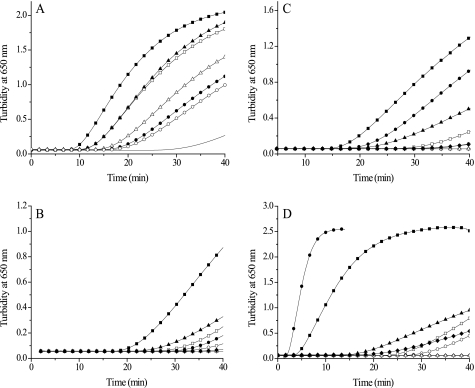
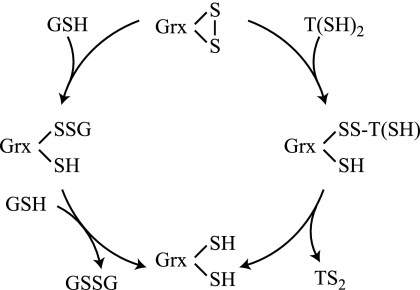
Trypanosoma brucei, the causative agent of African sleeping sickness, possesses two dithiol glutaredoxins (Grx1 and Grx2). Grx1 occurs in the cytosol and catalyzes protein deglutathionylations with k(cat)/K(m)-values of up to 2 × 10(5) M(-1) S(-1). It accelerates the reduction of ribonucleotide reductase by trypanothione although less efficiently than the parasite tryparedoxin and has low insulin disulfide reductase activity. Despite its classical CPYC active site, Grx1 forms dimeric iron-sulfur complexes with GSH, glutathionylspermidine, or trypanothione as non-protein ligands. Thus, contrary to the generally accepted assumption, replacement of the Pro is not a prerequisite for cluster formation. T. brucei Grx2 shows an unusual CQFC active site, and orthologues occur exclusively in trypanosomatids. Grx2 is enriched in mitoplasts, and fractionated digitonin lysis resulted in a co-elution with cytochrome c, suggesting localization in the mitochondrial intermembrane space. Grx2 catalyzes the reduction of insulin disulfide but not of ribonucleotide reductase and exerts deglutathionylation activity 10-fold lower than that of Grx1. RNA interference against Grx2 caused a growth retardation of procyclic cells consistent with an essential role. Grx1 and Grx2 are constitutively expressed with cellular concentrations of about 2 μM and 200 nM, respectively, in both the mammalian bloodstream and insect procyclic forms. Trypanothione reduces the disulfide form of both proteins with apparent rate constants that are 3 orders of magnitude higher than those with glutathione. Grx1 and, less efficiently, also Grx2 catalyze the reduction of GSSG by trypanothione. Thus, the Grxs play exclusive roles in the trypanothione-based thiol redox metabolism of African trypanosomes.


Figures

FIGURE 1.
FIGURE 1.
Comparison of T. brucei Grx1 and Grx2 with dithiol Grxs from other organisms. Strictly conserved residues and cysteines are depicted in boldface type. In addition, all cysteines are highlighted by a yellow background. Residues described as forming a groove for GSH binding on the surface of Grxs (10, 38, 39) or as undergoing, in addition to Cys30, large chemical shift changes in the NMR structure of Populus tremula GrxC4 upon titration with GSH (40) are shown with a blue background. Charged residues engaged in side chain interactions with a bound GSH molecule either in a mixed disulfide with mutants of E. coli Grx1 (38), human Grx1 (41), E. coli Grx3 (39), and yeast Grx2 (42) or in the non-covalent complex of human Grx2 with GSH (10) are highlighted by a red background. Those residues interacting with the glycine carboxylate of GSH are also underlined.
FIGURE 2.
FIGURE 2.
Depletion of Grx1 and Grx2 in T. brucei by RNA interference. Shown are proliferation profiles of bloodstream (A and B) and procyclic (C and D) T. brucei transfected with pHD678ms/ri-grx1 (A and C) and pHD678ms/ri-grx2 (B and D) and grown in the presence (+tet) or absence (−tet) of 1 μg/ml tet. Every 24 h, the cells were counted, an aliquot was removed for Western blot analysis, and the culture was diluted with fresh medium (±tet) to the initial cell density. Depicted is the mean of the cumulative cell density ± S.D. of three clones and representative Western blots of 1 × 10⁷ cells/lane with the specific antiserum against Grx1 (1:200) (A and C) and Grx2 (1:100) (B and D), respectively.
FIGURE 3.
FIGURE 3.
Quantification of Grx1 and Grx2 in bloodstream and procyclic T. brucei. A, representative Western blots of total cell lysates from cultured T. brucei in comparison with different amounts of recombinant Grx1 (bloodstream (BSF) (a) and procyclic (PC) (b) cells) and Grx2 (c). B, the integrated optical densities of each gel band were obtained with the BIO-Profil Biolight program and are depicted versus the protein amount (a, ■; b, ●; c, ▴). C, the cellular concentration of both proteins was derived from the standard lines. The values for Grx1 represent the mean ± S.D. of at least three determinations. In the case of Grx2, the values of two independent analyses are shown.
FIGURE 4.
FIGURE 4.
Subcellular localization of Grx1 and Grx2. A, immunofluorescence microscopy of bloodstream form (BSF) and procyclic (PC) parasites overexpressing Grx1-c-Myc2. The mitochondrion was stained with MitoTracker® Red (mito). Grx1 was visualized with the polyclonal antiserum (α-Grx1) and Alexa488 anti-guinea pig IgG as secondary antibody. DNA (nucleus and kinetoplast) was stained with DAPI. The images were superimposed with Adobe Photoshop software (merge). The whole parasites are shown on the right (phase contrast). Bar, 5 μm. B, cell lysate (corresponding to 4, 20, and 40 μg of total protein) and isolated mitoplasts (2.5, 10, and 50 μg of protein) of procyclic cells as well as recombinant Grx1 and Grx2 were subjected to Western blot analysis. LipDH and TXNPx served as mitochondrial and cytosolic markers, respectively. C, procyclic T. brucei were treated with increasing digitonin/protein ratios (mg/mg) as indicated at the top. Supernatant and pellet of each sample were subjected to Western blot analysis. In the case of TXNPx, LipDH, and acetate:succinate-CoA-transferase (ASCT), the samples applied onto the gel corresponded to 3.5 × 10⁶ cells. For the Western blots of cytochrome c (Cytc), Grx1, and Grx2, extracts from 1.4 × 10⁷ cells were analyzed.
FIGURE 5.
FIGURE 5.
Reduction of GSSG by T(SH)2 in the absence and presence of Grx1 and Grx2. The reactions were coupled to NADPH consumption catalyzed by TR, as outlined under “Experimental Procedures.” A, the reaction mixtures contained 8.4 μm (filled symbols) or 21 μm (empty symbols) T(SH)2 and 20 μm (−), 60 μm (■), 100 μm (○ and ●), or 200 μm (△ and ▴) GSSG. After about 80 s, Grx1 was added. The activities were calculated from the ΔA/min after subtracting the rate of the spontaneous reaction. B, Lineweaver-Burk plot of the respective analysis of Grx2 at a fixed concentration of 9.8 μm T(SH)2.
FIGURE 6.
FIGURE 6.
Reconstitution and analysis of the iron-sulfur cluster of Grx1. A, UV-visible spectrum of the Grx1-fusion protein (40 mg/ml) purified from E. coli. Inset, elution profile from the Superdex 75 column recording absorption at 280 nm (solid line), 320 nm (dashed line), and 420 nm (dotted line). The protein eluted in two peaks at 9.74 and 10.96 ml that correspond to 63.5 and 37.6 kDa, respectively. B, UV-visible spectrum of 230 μm tag-free recombinant Grx1 subjected to FeS cluster reconstitution in the presence of Gsp. Inset, gel chromatography profiles of untreated (broken line with squares and dots) and reconstituted protein (solid line) at 280 nm. Grx1 eluted at 13.16 ml and did not show any absorption at 320 or 420 nm. The reconstituted protein eluted in two peaks. The main one at 11.47 ml but not that at 13.16 ml also showed absorption at 320 (dashed line) and 420 nm (dotted line). C, spectra of 50 μm of Grx1 (squares) and Grx2 (circles) after reconstitution in the presence of 100 μm GSH (filled symbols) or Gsp (empty symbols) as well as of free Grx1 (solid line) and Grx2 (broken line). The spectra were recorded 1 h after reconstitution and normalized according to the molar extinction coefficient of the protein. D, 50 μm Grx1 reconstituted in the presence of 100 μm GSH was distributed into two cuvettes, 1 mm Gsp was added to the reference cuvette, and the absorption difference at 420 nm was monitored. Inset, UV-visible spectrum of the sample (dashed line) and the reference (solid line) solution 2 h after exposure to air as well of free Grx1 (dotted line). E, spectrum of 230 mm Grx1 reconstituted in the presence of 1 mm T(SH)2. Inset, the protein eluted from the Superdex 75 column at 11.46 and 12.96 ml. Both protein species absorbed at 320 nm (dashed line) and 420 nm (dotted line) in addition to 280 nm (solid line). The peak at 15.87 ml is a yet to be identified iron-T(SH)2-complex.
FIGURE 7.
FIGURE 7.
Comparison of T. brucei Grx1, Grx2, Tpx, and E. coli Grx1 in the insulin reduction assay. The reaction mixtures contained 130 μm insulin, 1.2 mm thiol, and various concentrations of the respective protein. A, T(SH)2-dependent reduction by different Grxs. −, control without dithiol protein; ■, 5 μm and □, 2.5 μm E. coli Grx1; ▴, 22 μm Grx2; ▿, 8 μm Grx2; ●, 43 μm Grx1; ○, 14 μm Grx1. B, Grx1-catalyzed reduction by different thiols. □ and ■, 635 μm T(SH)2; △ and ▴, 1.26 mm Gsp; ○ and ●, 628 μm dithioerythritol; ♢ and ♦, 1.23 mm GSH. Empty and filled symbols display the reaction in the absence and presence of 14 μm Grx1, respectively. C, Grx2-catalyzed reduction by different thiols. □ and ■, 624 μm T(SH)2; △ and ▴, 1.25 mm Gsp; ○ and ●, 628 μm dithioerythritol; ♢ and ♦, 1.3 mm GSH. Empty and filled symbols display the reaction without or with 8 μm Grx2. D, Tpx-catalyzed reduction by different thiols. □ and ■, 635 μm T(SH)2; △ and ▴, 1.26 mm Gsp; ○ and ●, 628 μm dithioerythritol; ♢ and ♦, 1.23 mm GSH. Empty and filled symbols show the reaction in the absence and presence of 3.5 μm Tpx, respectively. The kinetics depicted is representatives of two or three repetitions.
SCHEME 1
SCHEME 1

References

    1. Pedrajas J. R., Porras P., Martínez-Galisteo E., Padilla C. A., Miranda-Vizuete A., Bárcena J. A. (2002) Biochem. J. 364, 617–623 - PMC - PubMed
    1. Pai H. V., Starke D. W., Lesnefsky E. J., Hoppel C. L., Mieyal J. J. (2007) Antioxid. Redox Signal. 9, 2027–2033 - PubMed
    1. Lönn M. E., Hudemann C., Berndt C., Cherkasov V., Capani F., Holmgren A., Lillig C. H. (2008) Antioxid. Redox Signal. 10, 547–557 - PubMed
    1. Lillig C. H., Berndt C., Holmgren A. (2008) Biochim. Biophys. Acta 1780, 1304–1317 - PubMed
    1. Fernandes A. P., Holmgren A. (2004) Antioxid. Redox Signal. 6, 63–74 - PubMed

Publication types

MeSH terms

LinkOut - more resources