

Integration of early physiological responses predicts later illness severity in preterm infants
- PMID: 20826840
- PMCID: PMC3564961
- DOI: 10.1126/scitranslmed.3001304
Integration of early physiological responses predicts later illness severity in preterm infants
Abstract
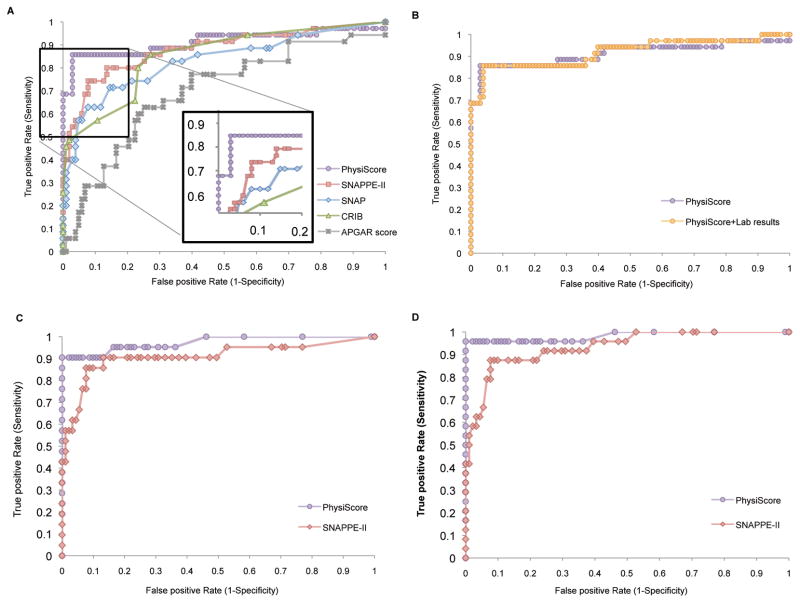
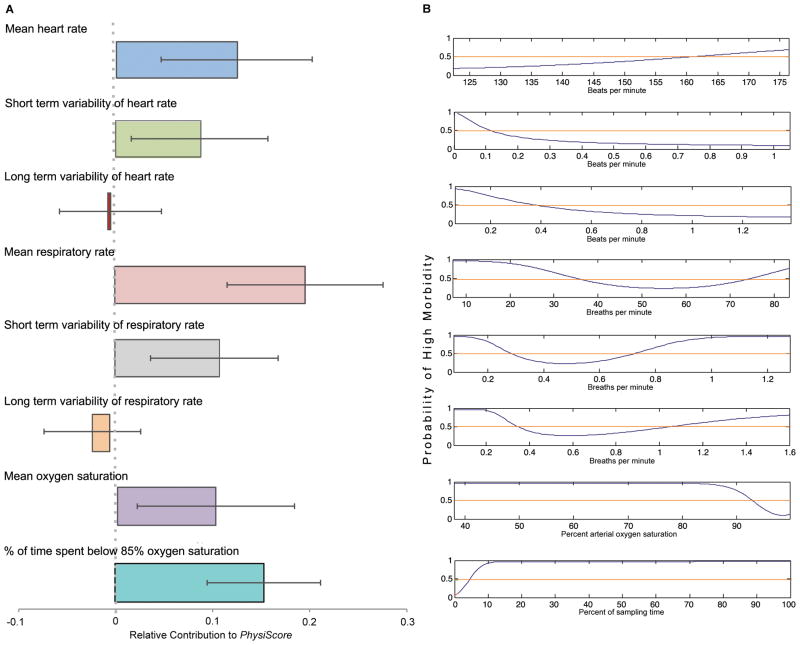
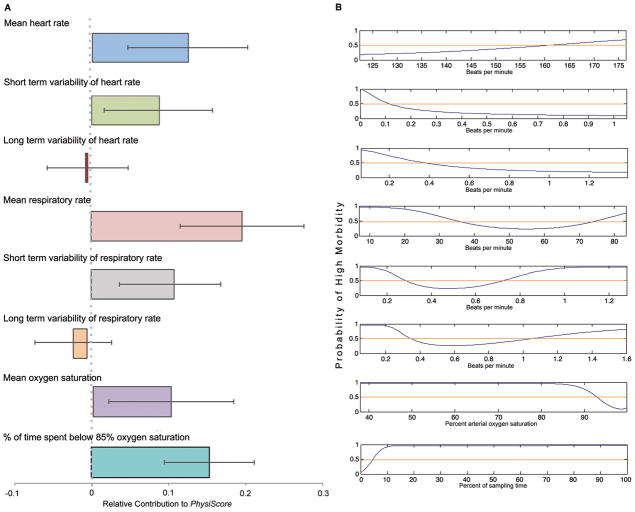
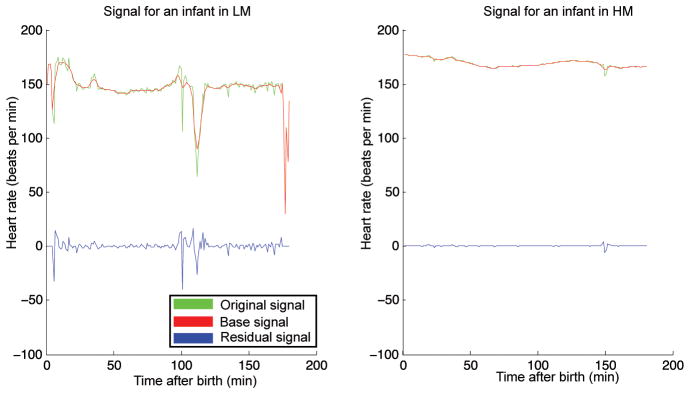
Physiological data are routinely recorded in intensive care, but their use for rapid assessment of illness severity or long-term morbidity prediction has been limited. We developed a physiological assessment score for preterm newborns, akin to an electronic Apgar score, based on standard signals recorded noninvasively on admission to a neonatal intensive care unit. We were able to accurately and reliably estimate the probability of an individual preterm infant's risk of severe morbidity on the basis of noninvasive measurements. This prediction algorithm was developed with electronically captured physiological time series data from the first 3 hours of life in preterm infants (< or =34 weeks gestation, birth weight < or =2000 g). Extraction and integration of the data with state-of-the-art machine learning methods produced a probability score for illness severity, the PhysiScore. PhysiScore was validated on 138 infants with the leave-one-out method to prospectively identify infants at risk of short- and long-term morbidity. PhysiScore provided higher accuracy prediction of overall morbidity (86% sensitive at 96% specificity) than other neonatal scoring systems, including the standard Apgar score. PhysiScore was particularly accurate at identifying infants with high morbidity related to specific complications (infection: 90% at 100%; cardiopulmonary: 96% at 100%). Physiological parameters, particularly short-term variability in respiratory and heart rates, contributed more to morbidity prediction than invasive laboratory studies. Our flexible methodology of individual risk prediction based on automated, rapid, noninvasive measurements can be easily applied to a range of prediction tasks to improve patient care and resource allocation.
Conflict of interest statement
Competing interests: The authors declare that they have no competing interests.
Figures
References
-
- Behrman R, Butler A, editors. Consequences and Prevention. National Academies Press; Washington, DC: 2007. Preterm Birth: Causes. - PubMed
-
- Robertson PA, Sniderman SH, Laros RK, Jr, Cowan R, Heilbron D, Goldenberg RL, Iams JD, Creasy RK. Neonatal morbidity according to gestational age and birthweight from five tertiary care centers in the United States, 1983 through 1986. Am J Obstet Gynecol. 1992;166:1629–1641. - PubMed
-
- Richardson DK, Gray JE, McCormick MC, Workman K, Goldmann DA. Score for Neonatal Acute Physiology: A physiologic severity index for neonatal intensive care. Pediatrics. 1993;91:617–623. - PubMed
-
- Richardson DK, Corcoran JD, Escobar GJ, Lee SK. SNAP-II and SNAPPE-II: Simplified newborn illness severity and mortality risk scores. J Pediatr. 2001;138:92–100. - PubMed
Publication types
MeSH terms
Grants and funding
LinkOut - more resources
Full Text Sources
Other Literature Sources
Medical
