Baseline CBF, and BOLD, CBF, and CMRO2 fMRI of visual and vibrotactile stimulations in baboons
- PMID: 20827260
- PMCID: PMC3049525
- DOI: 10.1038/jcbfm.2010.154
Baseline CBF, and BOLD, CBF, and CMRO2 fMRI of visual and vibrotactile stimulations in baboons
Abstract
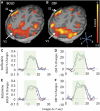
Neurovascular coupling associated with visual and vibrotactile stimulations in baboons anesthetized sequentially with isoflurane and ketamine was evaluated using multimodal functional magnetic resonance imaging (fMRI) on a clinical 3-Tesla scanner. Basal cerebral blood flow (CBF), and combined blood-oxygenation-level-dependent (BOLD) and CBF fMRI of visual and somatosensory stimulations were measured using pseudo-continuous arterial spin labeling. Changes in stimulus-evoked cerebral metabolic rate of oxygen (CMRO(2)) were estimated using calibrated fMRI. Arterial transit time for vessel, gray matter (GM), and white matter (WM) were 250, 570, and 823 ms, respectively. Gray matter and WM CBF, respectively, were 107.8±7.9 and 47.8±3.8 mL per 100 g per minute under isoflurane, and 108.8±10.3 and 48.7±4.2 mL per 100 g per minute under ketamine (mean±s.e.m., N=8 sessions, five baboons). The GM/WM CBF ratio was not statistically different between the two anesthetics, averaging 2.3±0.1. Hypercapnia evoked global BOLD and CBF increases. Blood-oxygenation-level-dependent, CBF, and CMRO(2) signal changes by visual and vibrotactile stimulations were 0.19% to 0.22%, 18% to 23%, and 4.9% to 6.7%, respectively. The CBF/CMRO(2) ratio was 2.9 to 4.7. Basal CBF and fMRI responses were not statistically different between the two anesthetics. This study establishes a multimodal fMRI protocol to probe clinically relevant functional, physiological and metabolic information in large nonhuman primates.
Figures


Similar articles
-
Caffeine-induced uncoupling of cerebral blood flow and oxygen metabolism: a calibrated BOLD fMRI study.Neuroimage. 2008 Mar 1;40(1):237-47. doi: 10.1016/j.neuroimage.2007.10.049. Epub 2007 Nov 12. Neuroimage. 2008. PMID: 18191583 Free PMC article.
-
The absolute CBF response to activation is preserved during elevated perfusion: Implications for neurovascular coupling measures.Neuroimage. 2016 Jan 15;125:198-207. doi: 10.1016/j.neuroimage.2015.10.023. Epub 2015 Oct 23. Neuroimage. 2016. PMID: 26477657 Free PMC article.
-
BOLD fMRI of visual and somatosensory-motor stimulations in baboons.Neuroimage. 2010 Oct 1;52(4):1420-7. doi: 10.1016/j.neuroimage.2010.05.014. Epub 2010 May 13. Neuroimage. 2010. PMID: 20471483 Free PMC article.
-
Non-BOLD contrast for laminar fMRI in humans: CBF, CBV, and CMRO2.Neuroimage. 2019 Aug 15;197:742-760. doi: 10.1016/j.neuroimage.2017.07.041. Epub 2017 Jul 20. Neuroimage. 2019. PMID: 28736310 Review.
-
Biophysical and physiological origins of blood oxygenation level-dependent fMRI signals.J Cereb Blood Flow Metab. 2012 Jul;32(7):1188-206. doi: 10.1038/jcbfm.2012.23. Epub 2012 Mar 7. J Cereb Blood Flow Metab. 2012. PMID: 22395207 Free PMC article. Review.
Cited by
-
Effects of flow changes on radiotracer binding: Simultaneous measurement of neuroreceptor binding and cerebral blood flow modulation.J Cereb Blood Flow Metab. 2019 Jan;39(1):131-146. doi: 10.1177/0271678X17725418. Epub 2017 Aug 17. J Cereb Blood Flow Metab. 2019. PMID: 28816571 Free PMC article.
-
Functional neuroimaging of the baboon during concurrent image-guided transcranial magnetic stimulation.Neuroimage. 2011 Aug 15;57(4):1393-401. doi: 10.1016/j.neuroimage.2011.05.065. Epub 2011 May 30. Neuroimage. 2011. PMID: 21664276 Free PMC article.
-
Anatomical, blood oxygenation level-dependent, and blood flow MRI of nonhuman primate (baboon) retina.Magn Reson Med. 2011 Aug;66(2):546-54. doi: 10.1002/mrm.22853. Epub 2011 Feb 28. Magn Reson Med. 2011. PMID: 21360746 Free PMC article.
-
Dynamics of the cerebral blood flow response to brief neural activity in human visual cortex.J Cereb Blood Flow Metab. 2020 Sep;40(9):1823-1837. doi: 10.1177/0271678X19869034. Epub 2019 Aug 20. J Cereb Blood Flow Metab. 2020. PMID: 31429358 Free PMC article.
-
White matter and hypoxic hypobaria in humans.Hum Brain Mapp. 2019 Aug 1;40(11):3165-3173. doi: 10.1002/hbm.24587. Epub 2019 Mar 29. Hum Brain Mapp. 2019. PMID: 30927318 Free PMC article.
References
-
- Buxton RB, Frank LR. A model for the coupling between cerebral blood flow and oxygen metabolism during neural stimulation. J Cereb Blood Flow Metab. 1997;17:64–72. - PubMed
-
- Cucchiara RF, Theye RA, Michenfelder JD. The effects of isoflurane on canine cerebral metabolism and blood flow. Anesthesiology. 1974;40:571–574. - PubMed
Publication types
MeSH terms
Substances
Grants and funding
LinkOut - more resources
Full Text Sources
Medical

