. 2010 Sep 23;467(7314):460-4.
doi: 10.1038/nature09386. Epub 2010 Sep 8.

A trans-acting locus regulates an anti-viral expression network and type 1 diabetes risk

Collaborators, Affiliations

A trans-acting locus regulates an anti-viral expression network and type 1 diabetes risk

Matthias Heinig et al. Nature. .

Abstract

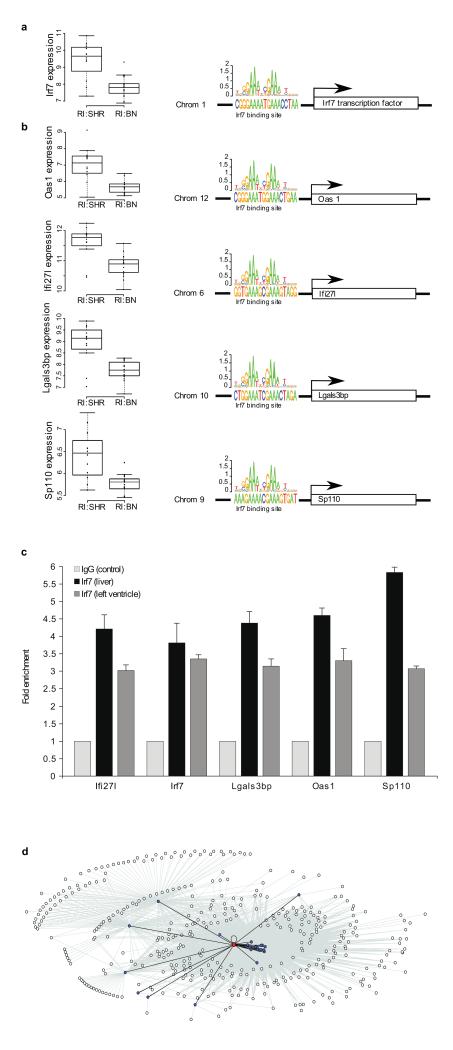
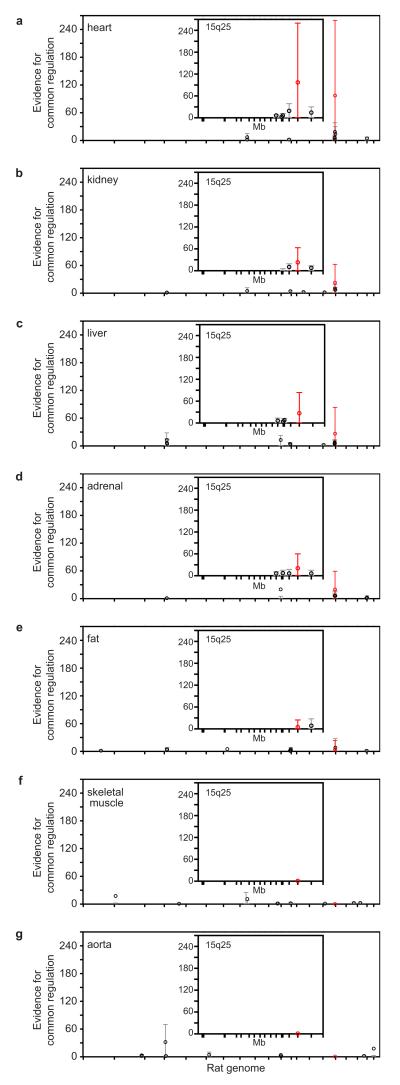
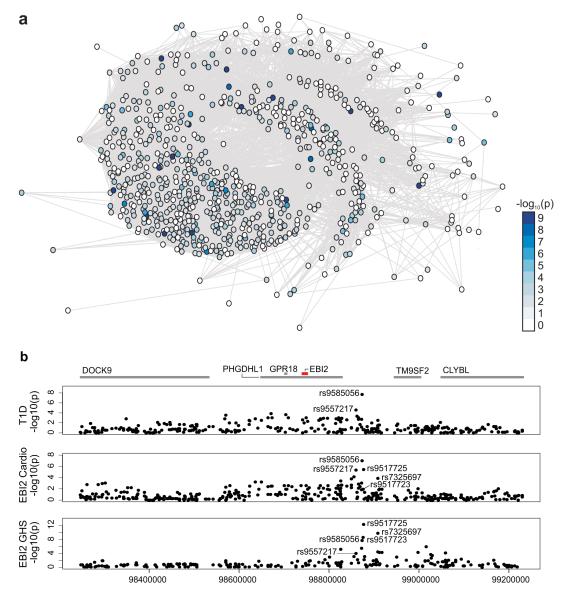
Combined analyses of gene networks and DNA sequence variation can provide new insights into the aetiology of common diseases that may not be apparent from genome-wide association studies alone. Recent advances in rat genomics are facilitating systems-genetics approaches. Here we report the use of integrated genome-wide approaches across seven rat tissues to identify gene networks and the loci underlying their regulation. We defined an interferon regulatory factor 7 (IRF7)-driven inflammatory network (IDIN) enriched for viral response genes, which represents a molecular biomarker for macrophages and which was regulated in multiple tissues by a locus on rat chromosome 15q25. We show that Epstein-Barr virus induced gene 2 (Ebi2, also known as Gpr183), which lies at this locus and controls B lymphocyte migration, is expressed in macrophages and regulates the IDIN. The human orthologous locus on chromosome 13q32 controlled the human equivalent of the IDIN, which was conserved in monocytes. IDIN genes were more likely to associate with susceptibility to type 1 diabetes (T1D)-a macrophage-associated autoimmune disease-than randomly selected immune response genes (P = 8.85 × 10(-6)). The human locus controlling the IDIN was associated with the risk of T1D at single nucleotide polymorphism rs9585056 (P = 7.0 × 10(-10); odds ratio, 1.15), which was one of five single nucleotide polymorphisms in this region associated with EBI2 (GPR183) expression. These data implicate IRF7 network genes and their regulatory locus in the pathogenesis of T1D.


Figures

Figure 1
Figure 1. The Irf7-driven inflammatory gene network (iDIN)
Trans-regulated expression of a, Irf7 and b, genes containing Irf7 transcription factor binding sites by rat chromosome 15q25 at SNP J666808. Left panels, gene expression in the left ventricle is shown in the recombinant inbred (RI) rat strains grouped by SHR or BN genotype at SNP J666808 (SHR allele, RI.SHR; BN allele, RI.BN). Right panels, transcription factor binding site predictions are represented for the five (out of 23 predicted) Irf7-target genes. The chromosome (Chrom) encoding the Irf7-target is shown to the left of the predicted Irf7 binding sites. These data provide evidence for a regulatory cascade in which a locus on chromosome 15q25 regulates the expression of Irf7 on chromosome 1 in an allele-dependent manner with consequent effects on Irf7-target genes mediated through Irf7 transcription factor binding sites. c, Quantitative chromatin immuno-precipitation of predicted Irf7-target genes. Direct binding of Irf7 to the promoters of the predicted targets Ifi27l, Irf7, Lgals3bp, Oas1, and Sp110 was confirmed in liver and heart tissues. Fold enrichments are shown relative to non-immune IgG control. d, The expanded Irf7-driven inflammatory gene network (iDIN) comprising 305 genes. Nodes represent genes, the node representing Irf7 is coloured red and its predicted targets are coloured blue. Edges connect genes that are either predicted Irf7-targets (black) or show significant Pearson correlation (FDR < 0.1%) to one of the predicted targets (grey).
Figure 2
Figure 2. Genetic mapping of regulatory ‘hot-spots’ for the iDIN
a-g, For each rat autosomal chromosome (x-axes), the strength of evidence for a SNP being a regulatory ‘hot-spot’ for controlling the network is measured by the average Bayes Factor (y-axes). Controlling the FDR at 1% level for each eQTL, the average Bayes Factor indicates the evidence in favour of common genetic regulation versus no genetic control, and is reported as a ratio between the strengths of these models (Supplementary Information). For the 10 largest regulatory hot-spots the average Bayes Factors (circles) and their 90% range (5th-95th percentiles) are reported; a single SNP (J666808) that is consistently and most strongly associated with the network in 5 out of 7 tissues is highlighted in red. Inserts, average Bayes Factors and 90% range for the SNPs on rat chromosome 15q25 (87,479,238 - 108,949,015 bp). SNP positions in the region are indicated by tick marks.
Figure 3
Figure 3. A gene network and locus for T1D risk
a, Schematic representation of the union of IRF7-driven gene networks that was created using the set of human orthologues of rat iDIN genes and human iDIN genes. A Wilcoxon rank test based gene set enrichment analysis (modified from Holden et al.) showed SNPs close to iDIN genes to be significantly more likely to associate with T1D in large-scale GWAS than SNPs close to randomly selected genes (P = 2.5 × 10⁻¹⁰) and randomly selected immune response genes (P = 8.8 × 10⁻⁶). Nodes represent iDIN genes and the node colour indicates the P-values (-log10 scale) of the association with T1D (see Methods). b, Results of EBI2 eQTL analysis in GHS (top panel), Cardiogenics (middle panel) and T1D association (bottom panel) at the human chromosome 13 locus that is orthologous to the 700kb rat chromosome 15q25 region. The upper panel shows the nominal –log10 P-values of marker regression against gene expression of EBI2 for all SNPs in the region. We defined EBI2 eQTL models by selecting SNPs using lasso regression (Supplementary Information) in GHS (rs9585056, rs9517723, rs7325697). When adding imputed SNPs, rs9517725 explains most of the variation of the EBI2 expression (P = 6.8 × 10⁻¹³) at this locus. Lasso model selection in Cardiogenics yielded an overlapping set of three SNPs (rs9557217, rs9585056, rs9517725). The lower panel shows the –log10 P-values of T1D association with SNPs in the region. SNP rs9585056 showed the strongest association with T1D (P = 7.0 × 10⁻¹⁰) amongst the genotyped markers.

References

    1. Honda K, et al. IRF-7 is the master regulator of type-I interferon-dependent immune responses. Nature. 2005;434:772–777. - PubMed
    1. Pereira JP, Kelly LM, Xu Y, Cyster JG. EBI2 mediates B cell segregation between the outer and centre follicle. Nature. 2009;460:1122–1126. - PMC - PubMed
    1. Gatto D, Paus D, Basten A, Mackay CR, Brink R. Guidance of B cells by the orphan G protein-coupled receptor EBI2 shapes humoral immune responses. Immunity. 2009;31:259–269. - PubMed
    1. Altshuler D, Daly MJ, Lander ES. Genetic mapping in human disease. Science. 2008;322:881–888. - PMC - PubMed
    1. Schadt EE. Molecular networks as sensors and drivers of common human diseases. Nature. 2009;461:218–223. - PubMed

Publication types

MeSH terms

Substances