. 2010:2010:728052.
doi: 10.1155/2010/728052. Epub 2010 Aug 17.

The Calcium-Dependent Interaction of S100B with Its Protein Targets

Affiliations

The Calcium-Dependent Interaction of S100B with Its Protein Targets

Danna B Zimmer et al. Cardiovasc Psychiatry Neurol. 2010.

Abstract

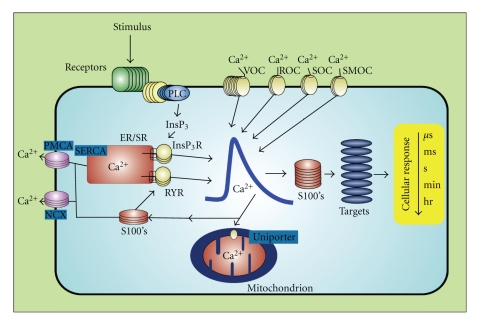
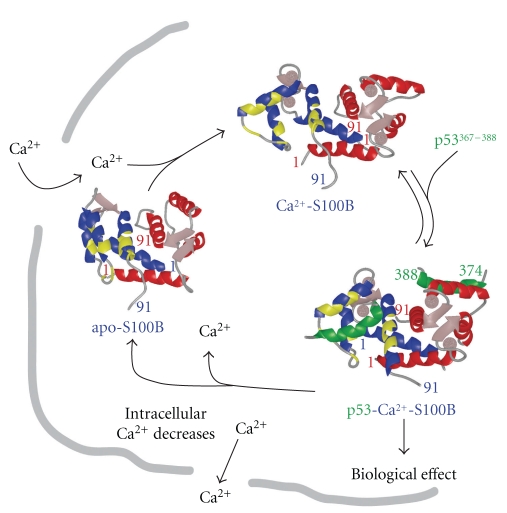
S100B is a calcium signaling protein that is a member of the S100 protein family. An important feature of S100B and most other S100 proteins (S100s) is that they often bind Ca(2+) ions relatively weakly in the absence of a protein target; upon binding their target proteins, Ca(2+)-binding then increases by as much as from 200- to 400-fold. This manuscript reviews the structural basis and physiological significance of increased Ca(2+)-binding affinity in the presence of protein targets. New information regarding redundancy among family members and the structural domains that mediate the interaction of S100B, and other S100s, with their targets is also presented. It is the diversity among individual S100s, the protein targets that they interact with, and the Ca(2+) dependency of these protein-protein interactions that allow S100s to transduce changes in [Ca(2+)](intracellular) levels into spatially and temporally unique biological responses.


Figures

Figure 1
Figure 1
S100s function as Ca2+-signaling proteins. S100s bind and regulate protein targets as well as other Ca2+-signaling proteins in a Ca2+-dependent manner. S100s are distributed in a cell-specific manner to generate cell-type specific activities [1, 2, 10].
Figure 2
Figure 2
The Ca2+-dependent S100-target protein interactions. In red/blue are subunits of S100B (dimerKD< 500 pM [1, 17]) with regions shaded (yellow) for residues that bind targets such as p53367-388 (green), p53 (p53321-346, KD = 24 ± 10 nM), or TRTK12 [10, 18].
Figure 3
Figure 3
Metal ion and target binding properties of S100 proteins. (a) Binding studies with Mn2+ were completed since it is a good probe of the high affinity Ca2+ binding site on S100B (EF2) [113, 135]. Free Mn2+ was measured by electron paramagnetic resonance (EPR) in the absence and presence of S100B (+/− target peptide TRTK12) [34]. In all four traces, total [Mn2+] is identical (80 μM) with the bottom trace (4th trace) showing the signal for total [Mn2+]. TRTK12 alone (1 mM) has no effect on the EPR signal (3rd trace), whereas, the addition of S100B (65 μM) binds Mn2+ and reduces free [Mn2+] (2nd trace). The addition of the same amount of S100B (65 μM) plus TRTK12 (1 mM, top trace) has the least free [Mn2+] and indicates that TRTK12 binding to S100B-Mn2+ enhances Mn2+ binding (compare traces 1 and 2). A similar effect was observed for SBi1 (unpublished) and for p53367-388 [109]. As for p53367-388 and SBi1, TRTK12 increased the affinity of S100B for Ca2+ in competition studies with Mn2+ and via stopped-flow kinetic measurements of Cakoff as monitored in competition with Tb3+. (b) Plot of the decrease in kobs as a function of [Ca2+]/[Tb3+] as used to determine the off rate of Ca2+ from the 2nd EF-hand (EF2, Cakoff). The kobs values at each [Ca2+]/[Tb3+] ratio were calculated from kinetic traces of stopped-flow experiments where Tb3+ (syringe C) is mixed with S100B at varying Ca2+ concentrations (syringe A) and [Tb3+] signal is monitored as a function of time (λ ex = 230 nm, λ em = 545 nm). A Cakoff of 60 ± 8/sec was calculated from these experiments with S100B alone. When either TRTK12 or SBi1 is present, then the calculated Cakoff value for S100B is reduced to 5 ± 3/sec similar to that found for p53367-388 [109]. These studies demonstrated that TRTK12, p53367-388, or SBi1 increased the affinity of S100B for Ca2+ at least in part by decreasing Cakoff. In (c), S100A1 was found to bind the full length ryanodine receptor (RyR) at 100 nM free calcium. Specifically, S100A1 competed full-length RyR1 away from agarose-linked CaM beads as judged by a decreased RyR1 band in an anti-RyR Western blot. Free CaM, a positive control, also competed the RyR away from CaM-linked beads [60, 67].
Figure 4
Figure 4
B-factors for X-ray structures of TRTK12-Ca2+-S100B (2.0 Å) and Ca2+-S100B (1.5 Å) from the PI's laboratory. (a) B-factors for backbone atoms for each subunit of Ca2+-S100B (blue, green) and for TRTK-Ca2+-S100B (red). (b) B-factors for sidechains with symbols as in (a). (c) Also shown is a ribbon diagram of the TRTK12-Ca2+-S100B structure with residues colored red in EF2 (residues 61–72), which display lower B-factors in the TRTK12-bound state (in panels (a) and (b)). These data are all published in Charpentier et al., 2010 [139].
Figure 5
Figure 5
Models for Ca2+-binding and then target-binding to an S100 protein. (Top) A model for the Ca2+-dependent interaction of S100B with target proteins involves 13 equilibrium constants (KI to KXIII), 11 states, and 4 conformational changes (LI–LIV) [109]. The most highly populated states and the predominant pathway are colored red; this is due to weak Ca2+ binding in the pseudo-EF-hand (site I), which greatly simplifies this model (see Scheme 1). Specifically, the binding of Ca2+ to the pseudo- and typical EF-hand in each S100B subunit is described by six states (A, AMI, AMII, AMIMII, BMI, and BMII), five equilibrium constants (KI = [A][M]/[AMI], KII = [A][M]/[AMII], KIII = [AMI][M]/[AMI,II], KIV = [AMII][M]/[AMI,II], and KXI = [BMII][M]/[BMI,II], two conformational changes (LI: AMII↔ BMII, LII: AMI,II↔ BMI,II) with corresponding rate constants, respectively, where A = S100B prior to the 90° reorientation of helix three of S100B, B = S100B after 90° reorientation of helix three, MI = a Ca2+ ion bound to EF-hand I (pseudo-EF-hand), MII = a Ca2+ ion bound to EF-hand II (typical EF-hand), MI,II = Ca2+ ions bound to EF-hand I and EF-hand II. Upon the addition of p53 or another target (S), the model expands to 11 possible states, 13 dissociation constants, and four possible conformational changes. Whether additional equilibriums occur (KXIV, KXV, and KXVI) is considered in Scheme 1. (Bottom) In a second model (Scheme 1), state A is defined as the “closed” conformation observed in the apo-state (Figure 2), and state B is after a 90° reorientation of helix 3 termed the “open” conformation. In black, are states hypothesized to be populated. [A-MII] and [B-MII] represent short-lived intermediates, and L1 is the Ca2+-dependent conformational change involving helix 3 of S100B upon binding Ca2+ (Figure 2). Based on NMR relaxation rate data from the PI's lab [136], KXIV highly favors state A. States are also considered via KXV and KXVI which result in B* states that represent an ensemble of dynamic structures, of which, only a subset fully coordinate Ca2+ as observed in X-ray structures [9]. It is hypothesized that KXV favors the B*MII state(s), whereas, KXVI favors B-MII-S, explaining the apparent increase in Ca2+-binding affinity using equilibrium binding measurements that monitor free [metal ion] (Figure 3).
Scheme 1
Scheme 1
Figure 6
Figure 6
Characterization of CaM-488 target protein binding. Equimolar concentrations of CaM kinase II (CKII) phosphorylase kinase (PK) were immobilized on a PVDF membrane and incubated with 100 nM CaM-488 in the presence of Ca2+ or EDTA. Panel A contains a representative dot blot image. The histograms in Panel B represent the mean pmoles CaM-488 bound in the presence (black bars) and absence (gray bars) of Ca2+ assayed in triplicate in two independent experiments. Consistent with reported Kds and Kas, both targets exhibited Ca2+-dependent binding with the higher affinity target, CKII, binding more CaM-488 (7.0 pmoles) when compared to the lower affinity target PK (0.8 pmoles).
Figure 7
Figure 7
S100A1-488 binding curves for glycogen phosphorylase a. Membranes containing varying concentrations of glycogen phosphorylase were incubated in S100A1-488 in the presence (∙) or absence (■) of Ca2+. A standard curve of fluorescence intensity per mg of S100-488 was used to determine the experimental amount of labeled S100 per dot of target protein (n = 17).
Figure 8
Figure 8
Target protein binding profiles for S100 family members. Membranes containing glycogen phosphorylase (a) (Gpa), glycogen phosphorylase (b) (Gpb), phosphoglucomutase (PGM), and tau (50 pmoles) were incubated in 100 nM Alexa Flour 488 labeled S100B (blue bars), S100A1 (red bars), S100P (green bars), S100A4 (brown bars), and S100A5 (yellow bars) in the presence (darker bars) or absence (lighter bars) of Ca2+. The histograms depict that the mean pmoles S100 bound ± the SEM and N's denote no detectable binding. Asterisks denote P ≤  .05 between the ±Ca2+ conditions.
Figure 9
Figure 9
Interaction of wild-type and mutant S100s with target proteins. Membranes containing 50 pmoles glycogen phosphorylase a (Gpa), glycogen phosphorylase b (Gpb), phosphoglucomutase (PGM), and tau were incubated in 100 nM S100B-488 (blue bars), S100A1-488 (red bars), chimeric S100B-A1-B-488 (purple bars), or S100A1(F88/89A-W90A)-488 (orange bars) in the presence (darker bars) or absence (lighter bars) of Ca2+. The histograms depict that the mean pmoles S100 bound ± the SEM and N's denote no detectable binding. The asterisks denote P ≤  .05, and the N's denote no detectable binding between the ±Ca2+ conditions.

Similar articles

Cited by

References

    1. Berridge MJ, Bootman MD, Roderick HL. Calcium signalling: dynamics, homeostasis and remodelling. Nature Reviews Molecular Cell Biology. 2003;4(7):517–529. - PubMed
    1. Berridge MJ. Inositol trisphosphate and calcium oscillations. Biochemical Society symposium. 2007;(74):1–7. - PubMed
    1. Moore BW. A soluble protein characteristic of the nervous system. Biochemical and Biophysical Research Communications. 1965;19(6):739–744. - PubMed
    1. Ravasi T, Hsu K, Goyette J, et al. Probing the S100 protein family through genomic and functional analysis. Genomics. 2004;84(1):10–22. - PubMed
    1. Donato R. Intracellular and extracellular roles of S100 proteins. Microscopy Research and Technique. 2003;60(6):540–551. - PubMed

LinkOut - more resources