Dynamic metabolic flux analysis demonstrated on cultures where the limiting substrate is changed from carbon to nitrogen and vice versa
- PMID: 20827435
- PMCID: PMC2934775
- DOI: 10.1155/2010/621645
Dynamic metabolic flux analysis demonstrated on cultures where the limiting substrate is changed from carbon to nitrogen and vice versa
Abstract
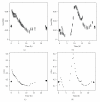
The main requirement for metabolic flux analysis (MFA) is that the cells are in a pseudo-steady state, that there is no accumulation or depletion of intracellular metabolites. In the past, the applications of MFA were limited to the analysis of continuous cultures. This contribution introduces the concept of dynamic MFA and extends MFA so that it is applicable to transient cultures. Time series of concentration measurements are transformed into flux values. This transformation involves differentiation, which typically increases the noisiness of the data. Therefore, a noise-reducing step is needed. In this work, polynomial smoothing was used. As a test case, dynamic MFA is applied on Escherichia coli cultivations shifting from carbon limitation to nitrogen limitation and vice versa. After switching the limiting substrate from N to C, a lag phase was observed accompanied with an increase in maintenance energy requirement. This lag phase did not occur in the C- to N-limitation case.
Figures


Similar articles
-
OptMDFpathway: Identification of metabolic pathways with maximal thermodynamic driving force and its application for analyzing the endogenous CO2 fixation potential of Escherichia coli.PLoS Comput Biol. 2018 Sep 24;14(9):e1006492. doi: 10.1371/journal.pcbi.1006492. eCollection 2018 Sep. PLoS Comput Biol. 2018. PMID: 30248096 Free PMC article.
-
Metabolic engineering of isopropyl alcohol-producing Escherichia coli strains with 13 C-metabolic flux analysis.Biotechnol Bioeng. 2017 Dec;114(12):2782-2793. doi: 10.1002/bit.26390. Epub 2017 Aug 17. Biotechnol Bioeng. 2017. PMID: 28755490
-
Decrease of energy spilling in Escherichia coli continuous cultures with rising specific growth rate and carbon wasting.BMC Syst Biol. 2011 Jul 5;5:106. doi: 10.1186/1752-0509-5-106. BMC Syst Biol. 2011. PMID: 21726468 Free PMC article.
-
Flux analysis and control of the central metabolic pathways in Escherichia coli.FEMS Microbiol Rev. 1996 Dec;19(2):85-116. doi: 10.1111/j.1574-6976.1996.tb00255.x. FEMS Microbiol Rev. 1996. PMID: 8988566 Review.
-
Isotopically nonstationary metabolic flux analysis (INST-MFA): putting theory into practice.Curr Opin Biotechnol. 2018 Dec;54:80-87. doi: 10.1016/j.copbio.2018.02.013. Epub 2018 Mar 6. Curr Opin Biotechnol. 2018. PMID: 29522915 Review.
Cited by
-
Integrating flux balance analysis into kinetic models to decipher the dynamic metabolism of Shewanella oneidensis MR-1.PLoS Comput Biol. 2012 Feb;8(2):e1002376. doi: 10.1371/journal.pcbi.1002376. Epub 2012 Feb 2. PLoS Comput Biol. 2012. PMID: 22319437 Free PMC article.
-
Metabolic flexibility of D-ribose producer strain of Bacillus pumilus under environmental perturbations.J Ind Microbiol Biotechnol. 2012 Aug;39(8):1227-43. doi: 10.1007/s10295-012-1115-z. Epub 2012 Mar 22. J Ind Microbiol Biotechnol. 2012. PMID: 22438109
-
Clostridium butyricum population balance model: Predicting dynamic metabolic flux distributions using an objective function related to extracellular glycerol content.PLoS One. 2018 Dec 20;13(12):e0209447. doi: 10.1371/journal.pone.0209447. eCollection 2018. PLoS One. 2018. PMID: 30571717 Free PMC article.
-
Expanding a dynamic flux balance model of yeast fermentation to genome-scale.BMC Syst Biol. 2011 May 19;5:75. doi: 10.1186/1752-0509-5-75. BMC Syst Biol. 2011. PMID: 21595919 Free PMC article.
-
Methods and advances in metabolic flux analysis: a mini-review.J Ind Microbiol Biotechnol. 2015 Mar;42(3):317-25. doi: 10.1007/s10295-015-1585-x. Epub 2015 Jan 23. J Ind Microbiol Biotechnol. 2015. PMID: 25613286 Review.
References
-
- van der Heijden RTJM, Heijnen JJ, Hellinga C, Romein B, Luyben KCAM. Linear constraint relations in biochemical reaction systems: I. Classification of the calculability and the balanceability of conversion rates. Biotechnology and Bioengineering. 1994;43(1):3–10. - PubMed
-
- van der Heijden RTJM, Romein B, Heijnen JJ, Hellinga C, Luyben KCAM. Linear constraint relations in biochemical reaction systems: II. Diagnosis and estimation of gross errors. Biotechnology and Bioengineering. 1994;43(1):11–20. - PubMed
-
- Romein B. Mathematical modelling of mammalian cells in suspension culture. Delft, The Netherlands: Technische Universiteit Delft; 2001. Ph.D. thesis.
-
- Lequeux G, Johansson L, Maertens J, Vanrolleghem PA, Lidén G. MFA for overdetermined systems reviewed and compared with RNA expression data to elucidate the difference in shikimate yield between carbon- and phosphate-limited continuous cultures of E. coli W3110.shik1. Biotechnology Progress. 2006;22(4):1056–1070. - PubMed
-
- Wiechert W, Möllney M, Petersen S, De Graaf AA. A universal framework for 13C metabolic flux analysis. Metabolic Engineering. 2001;3(3):265–283. - PubMed
Publication types
MeSH terms
Substances
LinkOut - more resources
Full Text Sources
Research Materials
Miscellaneous

