

Investigating neoplastic progression of ulcerative colitis with label-free comparative proteomics
- PMID: 20828217
- PMCID: PMC3017661
- DOI: 10.1021/pr100574p
Investigating neoplastic progression of ulcerative colitis with label-free comparative proteomics
Abstract
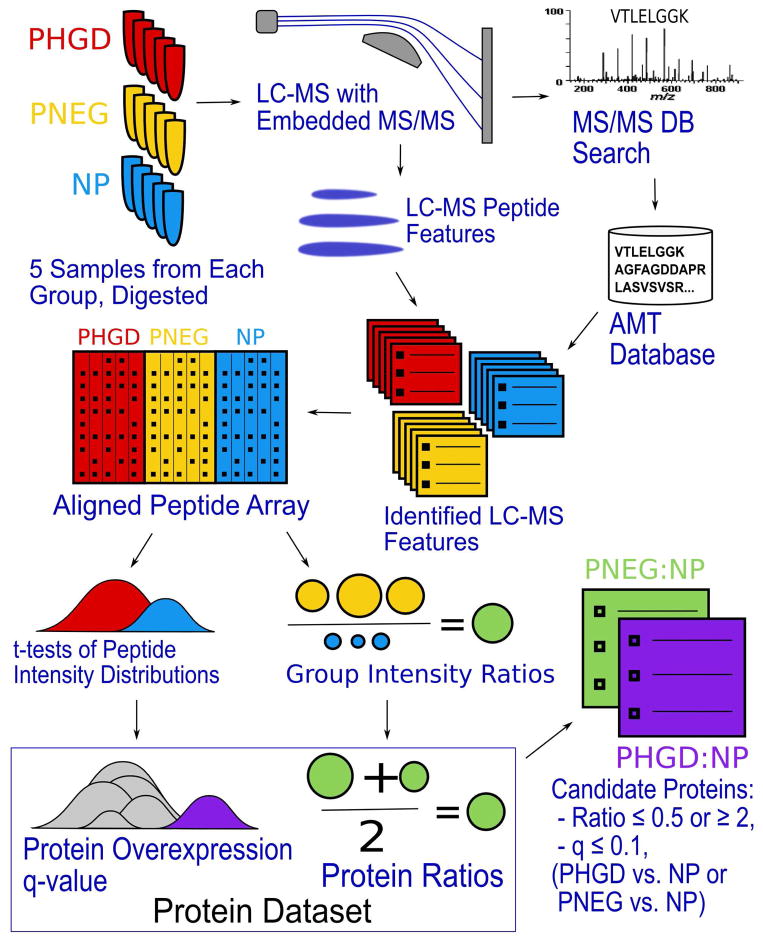
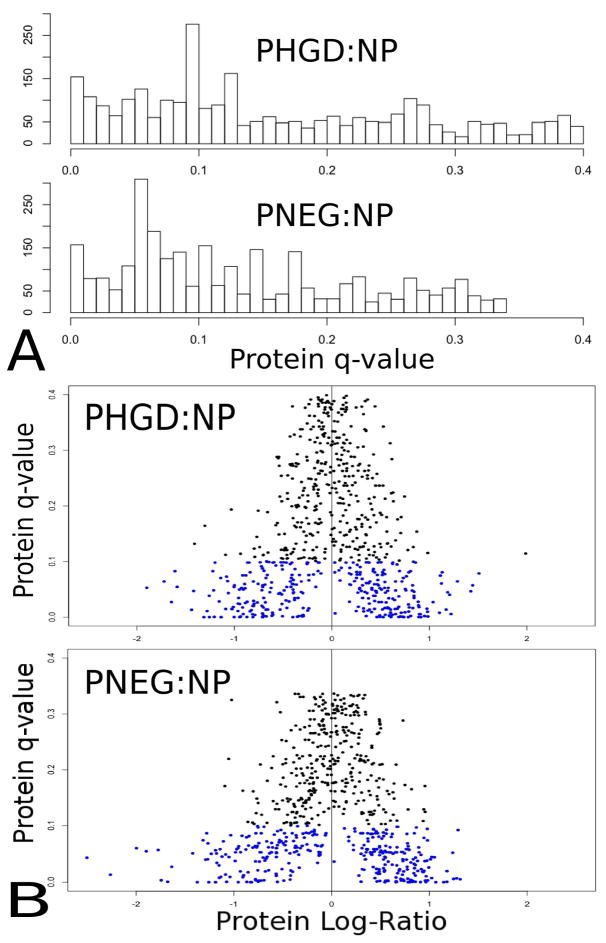
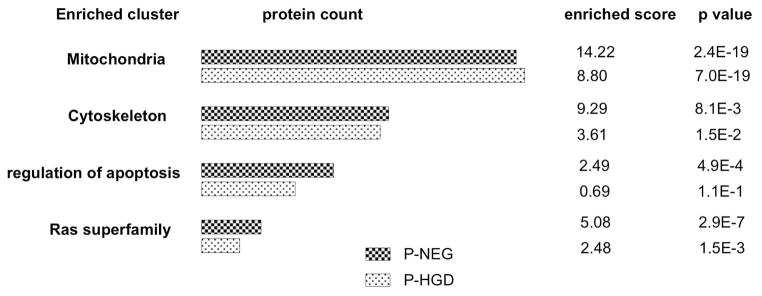
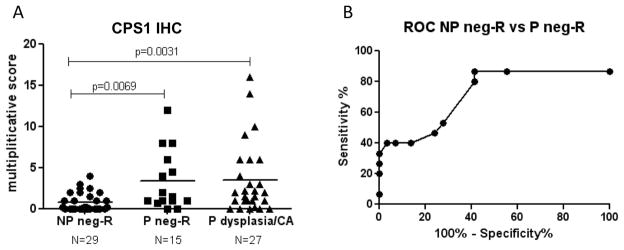
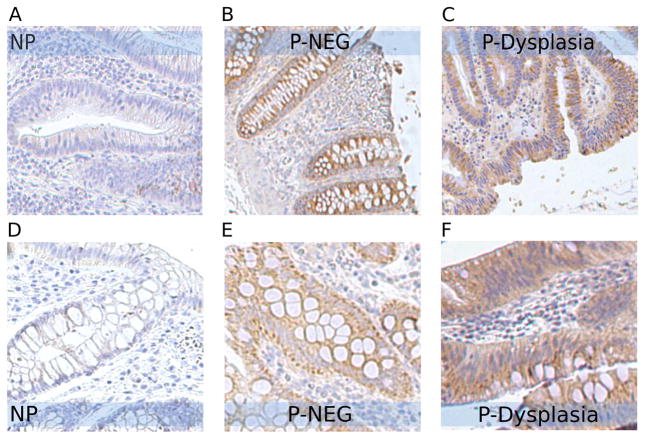
Patients with extensive ulcerative colitis (UC) have an increased risk of colorectal cancer. Although UC patients generally undergo lifelong colonoscopic surveillance to detect dysplasia or cancer in the colon, detection of cancer in this manner is expensive and invasive. An objective biomarker of dysplasia would vastly improve the clinical management of cancer risk in UC patients. In the current study, accurate mass and time methods with ion intensity-based label-free proteomics are applied to profile individual rectal and colon samples from UC patients with dysplasia or cancer (UC progressors) compared to rectal samples from patients that are dysplasia/cancer free (UC nonprogressors) to identify a set of proteins in the rectum mucosa that differentiate the two groups. In addition to the identification of proteins in UC dysplastic colon tissue, we for the first time identified differentially expressed proteins in nondysplastic rectal tissue from UC progressors. This provides a candidate pool of biomarkers for dysplasia/cancer that could be detected in a random nondysplastic rectal biopsy. Mitochondrial proteins, cytoskeletal proteins, RAS superfamily, proteins relating to apoptosis and metabolism were important protein clusters differentially expressed in the nondysplastic and dysplastic tissues of UC progressors, suggesting their importance in the early stages of UC neoplastic progression. Among the differentially expressed proteins, immunohistochemistry analysis confirmed that TRAP1 displayed increased IHC staining in UC progressors, in both dysplastic and nondysplastic tissue, and CPS1 showed a statistically significant difference in IHC staining between the nonprogressor and progressor groups. Furthermore, rectal CPS1 staining could be used to predict dysplasia or cancer in the colon with 87% sensitivity and 45% specificity, demonstrating the feasibility of using surrogate biomarkers in rectal biopsies to predict dysplasia and/or cancer in the colon.
Figures
References
-
- Ekbom A, Helmick C, Zack M, Adami HO. Ulcerative colitis and colorectal cancer. A population-based study. N Engl J Med. 1990;323(18):1228–33. - PubMed
-
- Rubin CE, Haggitt RC, Burmer GC, Brentnall TA, Stevens AC, Levine DS, Dean PJ, Kimmey M, Perera DR, Rabinovitch PS. DNA aneuploidy in colonic biopsies predicts future development of dysplasia in ulcerative colitis. Gastroenterology. 1992;103(5):1611–20. - PubMed
-
- Riddell RH, Goldman H, Ransohoff DF, Appelman HD, Fenoglio CM, Haggitt RC, Ahren C, Correa P, Hamilton SR, Morson BC, et al. Dysplasia in inflammatory bowel disease: standardized classification with provisional clinical applications. Hum Pathol. 1983;14(11):931–68. - PubMed
-
- America AH, Cordewener JH. Comparative LC-MS: a landscape of peaks and valleys. Proteomics. 2008;8(4):731–49. - PubMed
Publication types
MeSH terms
Substances
Grants and funding
LinkOut - more resources
Full Text Sources
Other Literature Sources
Medical
Miscellaneous
