

Epigenetic control of vascular smooth muscle cells in Marfan and non-Marfan thoracic aortic aneurysms
- PMID: 20829218
- PMCID: PMC3020128
- DOI: 10.1093/cvr/cvq291
Epigenetic control of vascular smooth muscle cells in Marfan and non-Marfan thoracic aortic aneurysms
Abstract
Aims: Human thoracic aortic aneurysms (TAAs) are characterized by extracellular matrix breakdown associated with progressive smooth muscle cell (SMC) rarefaction. These features are present in all types of TAA: monogenic forms [mainly Marfan syndrome (MFS)], forms associated with bicuspid aortic valve (BAV), and degenerative forms. Initially described in a mouse model of MFS, the transforming growth factor-β1 (TGF-β1)/Smad2 signalling pathway is now assumed to play a role in TAA of various aetiologies. However, the relation between the aetiological diversity and the common cell phenotype with respect to TGF-β signalling remains unexplained.
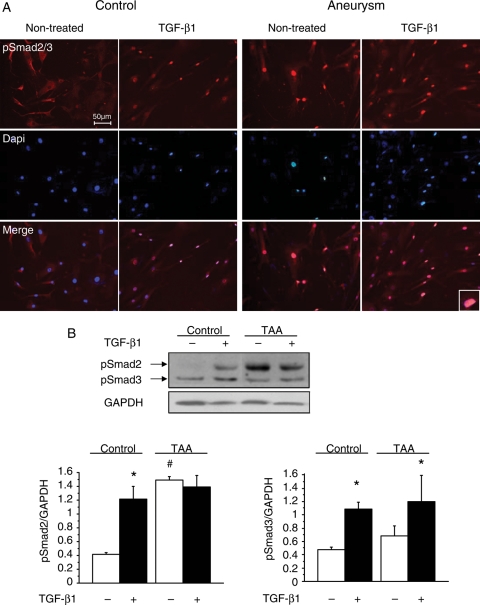
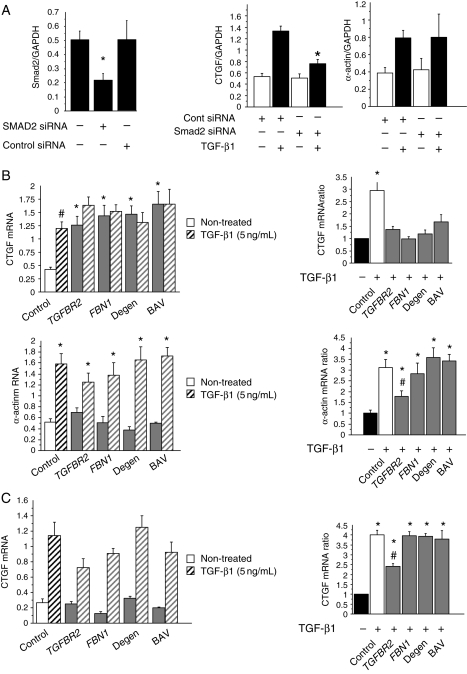
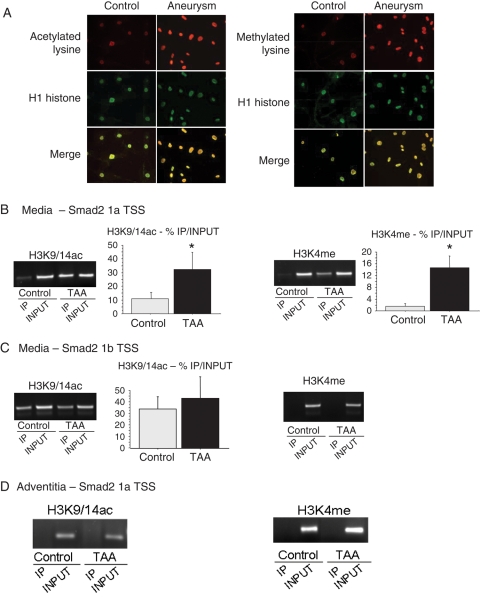
Methods and results: This study was performed on human aortic samples, including TAA [MFS, n = 14; BAV, n = 15; and degenerative, n = 19] and normal aortas (n = 10) from which tissue extracts and human SMCs and fibroblasts were obtained. We show that all types of TAA share a complex dysregulation of Smad2 signalling, independent of TGF-β1 in TAA-derived SMCs (pharmacological study, qPCR). The Smad2 dysregulation is characterized by an SMC-specific, heritable activation and overexpression of Smad2, compared with normal aortas. The cell specificity and heritability of this overexpression strongly suggest the implication of epigenetic control of Smad2 expression. By chromatin immunoprecipitation, we demonstrate that the increases in H3K9/14 acetylation and H3K4 methylation are involved in Smad2 overexpression in TAA, in a cell-specific and transcription start site-specific manner.
Conclusion: Our results demonstrate the heritability, the cell specificity, and the independence with regard to TGF-β1 and genetic backgrounds of the Smad2 dysregulation in human thoracic aneurysms and the involvement of epigenetic mechanisms regulating histone marks in this process.
Figures


Similar articles
-
Smad2-dependent protease nexin-1 overexpression differentiates chronic aneurysms from acute dissections of human ascending aorta.Arterioscler Thromb Vasc Biol. 2013 Sep;33(9):2222-32. doi: 10.1161/ATVBAHA.113.301327. Epub 2013 Jun 27. Arterioscler Thromb Vasc Biol. 2013. PMID: 23814118
-
Targeted gene expression analyses and immunohistology suggest a pro-proliferative state in tricuspid aortic valve-, and senescence and viral infections in bicuspid aortic valve-associated thoracic aortic aneurysms.Atherosclerosis. 2018 Apr;271:111-119. doi: 10.1016/j.atherosclerosis.2018.02.007. Epub 2018 Feb 5. Atherosclerosis. 2018. PMID: 29486395
-
Characteristics of TAV- and BAV-associated thoracic aortic aneurysms--smooth muscle cell biology, expression profiling, and histological analyses.Atherosclerosis. 2012 Feb;220(2):355-61. doi: 10.1016/j.atherosclerosis.2011.11.035. Epub 2011 Nov 28. Atherosclerosis. 2012. PMID: 22178424
-
From genetics to response to injury: vascular smooth muscle cells in aneurysms and dissections of the ascending aorta.Cardiovasc Res. 2018 Mar 15;114(4):578-589. doi: 10.1093/cvr/cvy006. Cardiovasc Res. 2018. PMID: 29360940 Free PMC article. Review.
-
Pathophysiology of thoracic aortic aneurysm (TAA): is it not one uniform aorta? Role of embryologic origin.Prog Cardiovasc Dis. 2013 Jul-Aug;56(1):68-73. doi: 10.1016/j.pcad.2013.04.002. Epub 2013 May 15. Prog Cardiovasc Dis. 2013. PMID: 23993239 Free PMC article. Review.
Cited by
-
Histone methylation and vascular biology.Clin Epigenetics. 2020 Feb 18;12(1):30. doi: 10.1186/s13148-020-00826-4. Clin Epigenetics. 2020. PMID: 32070413 Free PMC article. Review.
-
Postnatal Deletion of the Type II Transforming Growth Factor-β Receptor in Smooth Muscle Cells Causes Severe Aortopathy in Mice.Arterioscler Thromb Vasc Biol. 2015 Dec;35(12):2647-56. doi: 10.1161/ATVBAHA.115.306573. Epub 2015 Oct 22. Arterioscler Thromb Vasc Biol. 2015. PMID: 26494233 Free PMC article.
-
Calcific aortic valve stenosis: methods, models, and mechanisms.Circ Res. 2011 May 27;108(11):1392-412. doi: 10.1161/CIRCRESAHA.110.234138. Circ Res. 2011. PMID: 21617136 Free PMC article. Review.
-
The pathology and pathobiology of bicuspid aortic valve: State of the art and novel research perspectives.J Pathol Clin Res. 2015 Jun 24;1(4):195-206. doi: 10.1002/cjp2.21. eCollection 2015 Oct. J Pathol Clin Res. 2015. PMID: 27499904 Free PMC article.
-
Epigenetics and vascular diseases.J Mol Cell Cardiol. 2019 Aug;133:148-163. doi: 10.1016/j.yjmcc.2019.06.010. Epub 2019 Jun 15. J Mol Cell Cardiol. 2019. PMID: 31211956 Free PMC article. Review.
References
-
- Shi Y, Massague J. Mechanisms of TGF-beta signaling from cell membrane to the nucleus. Cell. 2003;113:685–700. doi:10.1016/S0092-8674(03)00432-X. - DOI - PubMed
-
- Derynck R, Zhang YE. Smad-dependent and Smad-independent pathways in TGF-beta family signalling. Nature. 2003;425:577–584. doi:10.1038/nature02006. - DOI - PubMed
-
- Liu C, Gaca MD, Swenson ES, Vellucci VF, Reiss M, Wells RG. Smads 2 and 3 are differentially activated by transforming growth factor-beta (TGF-beta) in quiescent and activated hepatic stellate cells. Constitutive nuclear localization of Smads in activated cells is TGF-beta-independent. J Biol Chem. 2003;278:11721–11728. doi:10.1074/jbc.M207728200. - DOI - PubMed
-
- Massague J, Wotton D. Transcriptional control by the TGF-beta/Smad signaling system. EMBO J. 2000;19:1745–1754. doi:10.1093/emboj/19.8.1745. - DOI - PMC - PubMed
-
- Schmierer B, Tournier AL, Bates PA, Hill CS. Mathematical modeling identifies Smad nucleocytoplasmic shuttling as a dynamic signal-interpreting system. Proc Natl Acad Sci USA. 2008;105:6608–6613. doi:10.1073/pnas.0710134105. - DOI - PMC - PubMed
Publication types
MeSH terms
Substances
LinkOut - more resources
Full Text Sources
Other Literature Sources
Medical
Molecular Biology Databases
Miscellaneous
