. 2010 Nov 15;19(22):4529-42.
doi: 10.1093/hmg/ddq383. Epub 2010 Sep 9.

Glutaredoxin 2 prevents aggregation of mutant SOD1 in mitochondria and abolishes its toxicity

Affiliations

Glutaredoxin 2 prevents aggregation of mutant SOD1 in mitochondria and abolishes its toxicity

Alberto Ferri et al. Hum Mol Genet. .

Abstract

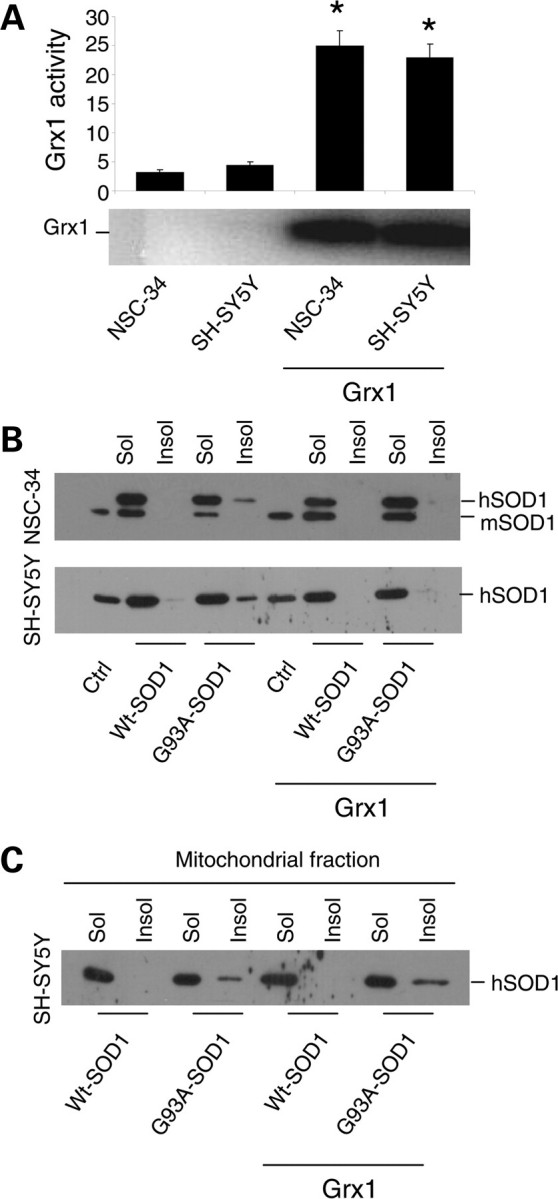
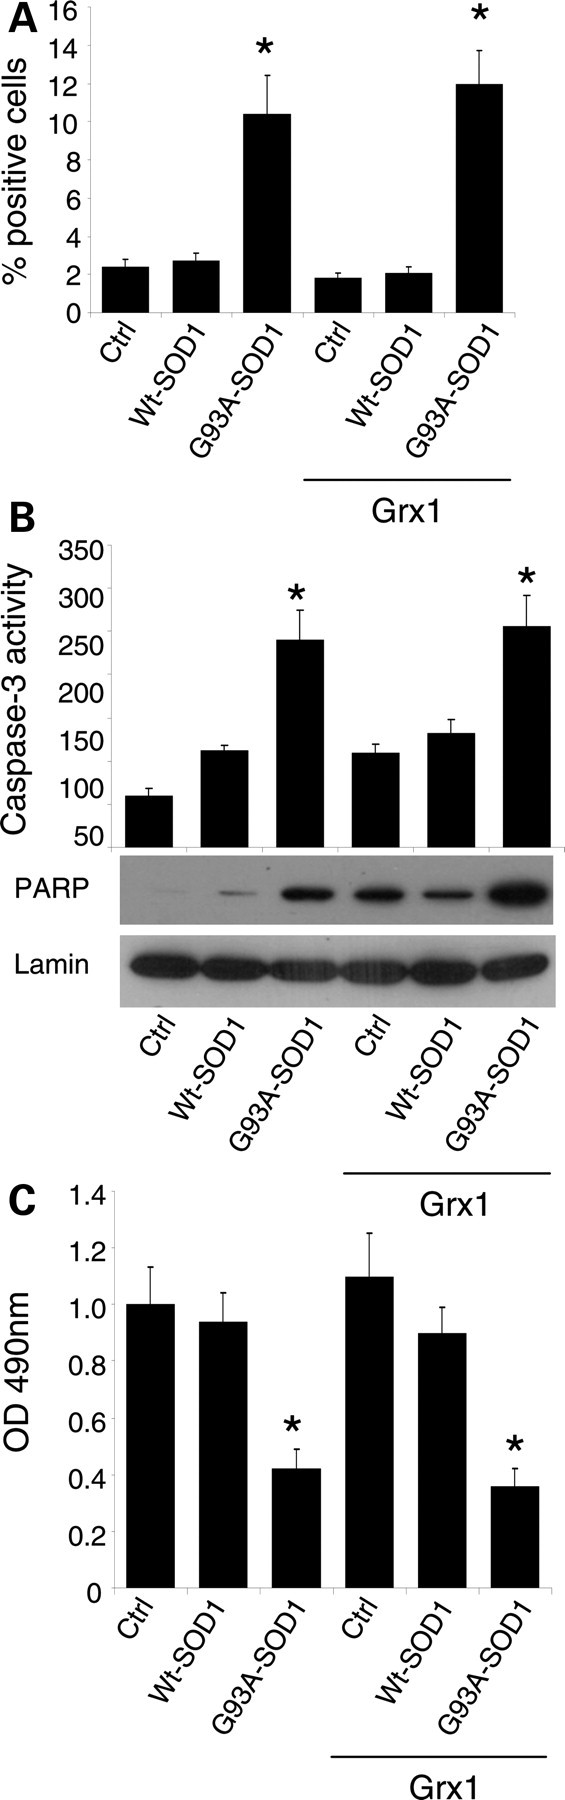
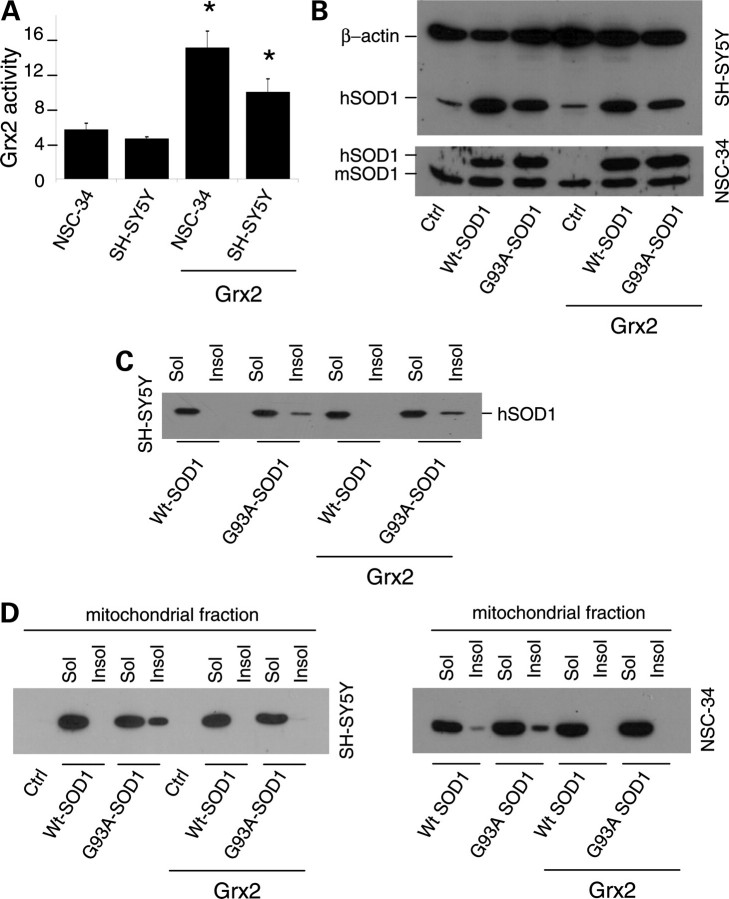
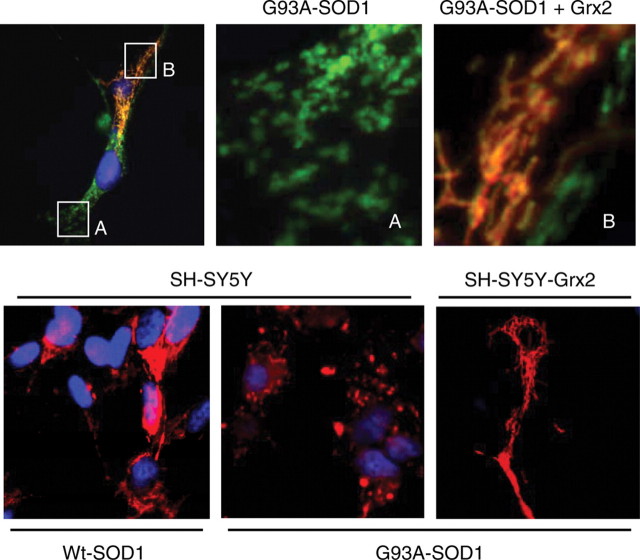
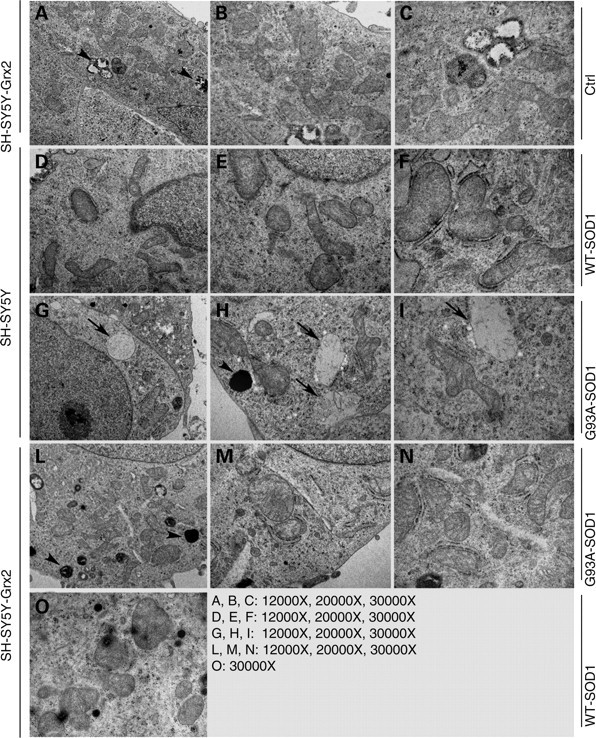
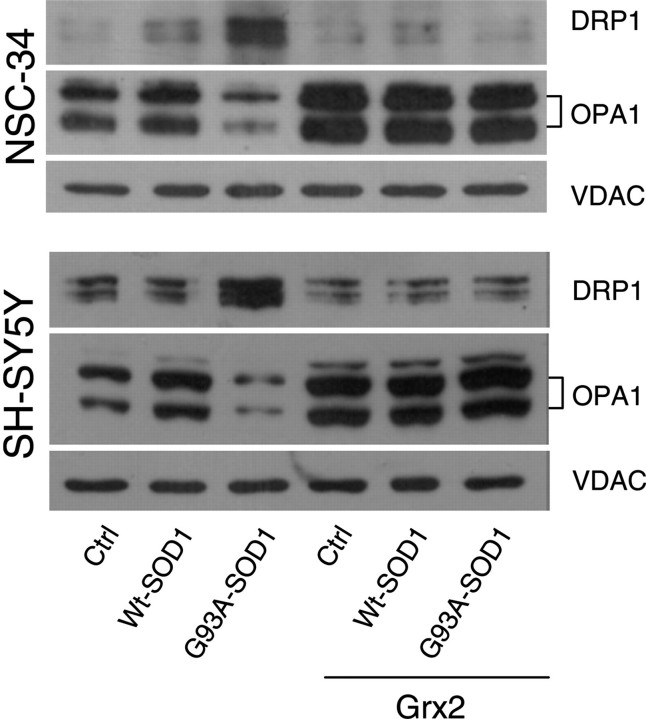
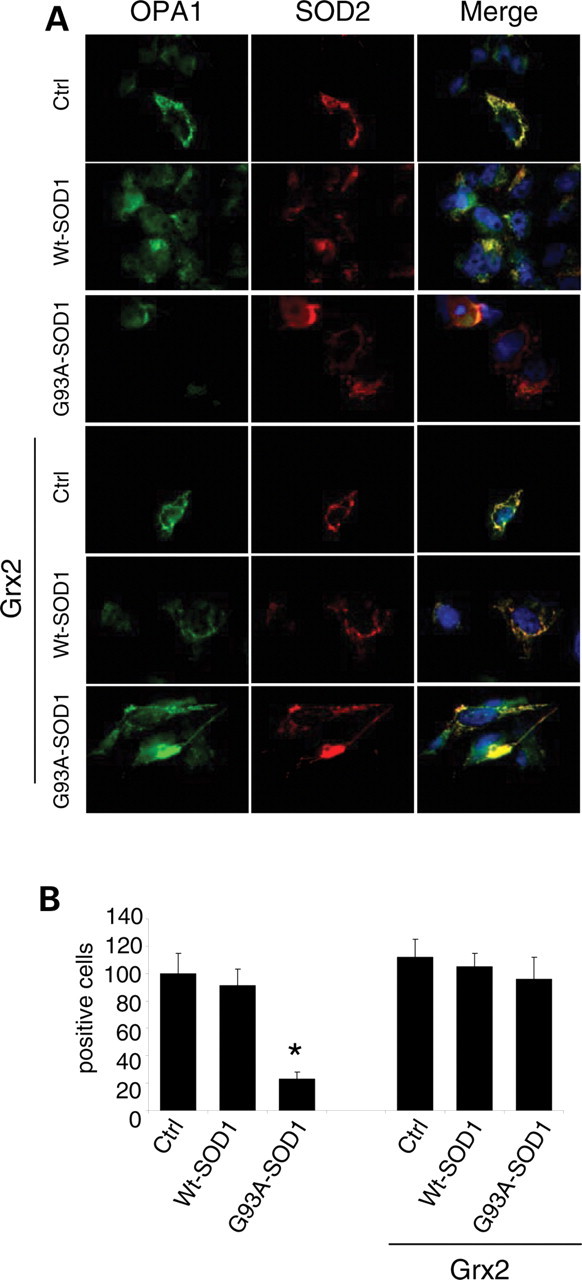
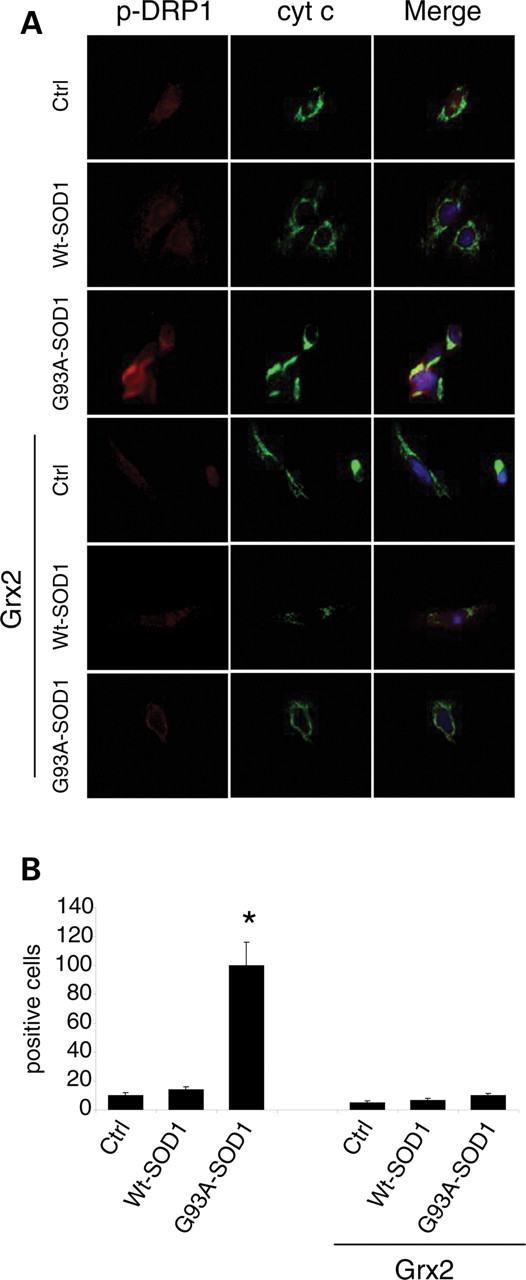
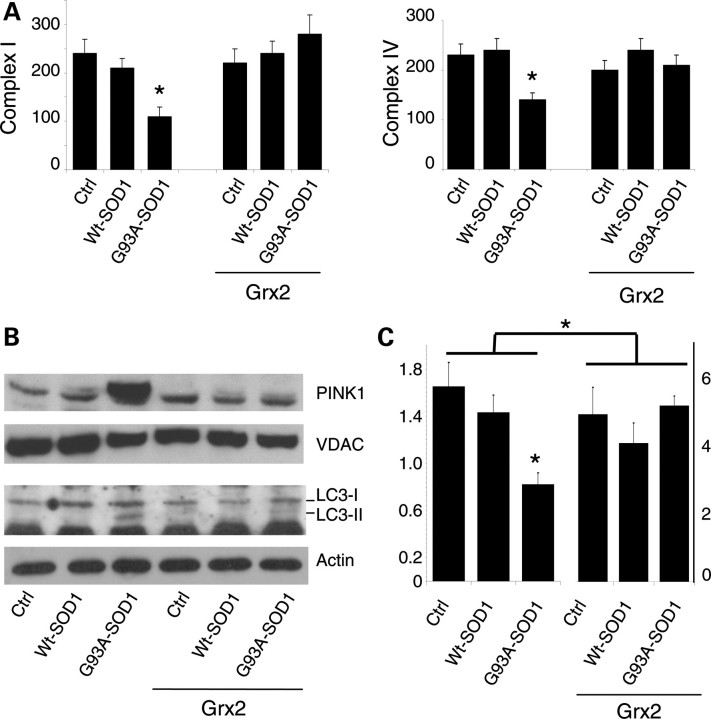
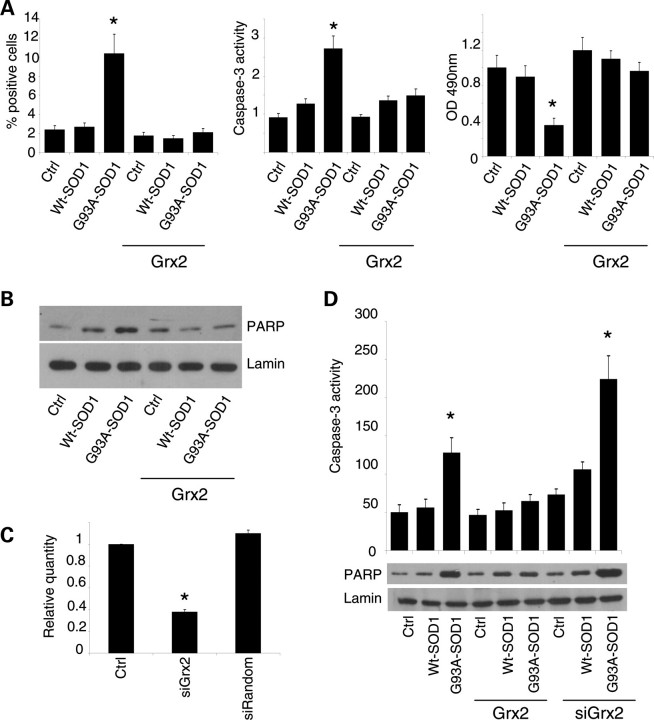
Vulnerability of motoneurons in amyotrophic lateral sclerosis (ALS) arises from a combination of several mechanisms, including protein misfolding and aggregation, mitochondrial dysfunction and oxidative damage. Protein aggregates are found in motoneurons in models for ALS linked to a mutation in the gene coding for Cu,Zn superoxide dismutase (SOD1) and in ALS patients as well. Aggregation of mutant SOD1 in the cytoplasm and/or into mitochondria has been repeatedly proposed as a main culprit for the degeneration of motoneurons. It is, however, still debated whether SOD1 aggregates represent a cause, a correlate or a consequence of processes leading to cell death. We have exploited the ability of glutaredoxins (Grxs) to reduce mixed disulfides to protein thiols either in the cytoplasm and in the IMS (Grx1) or in the mitochondrial matrix (Grx2) as a tool for restoring a correct redox environment and preventing the aggregation of mutant SOD1. Here we show that the overexpression of Grx1 increases the solubility of mutant SOD1 in the cytosol but does not inhibit mitochondrial damage and apoptosis induced by mutant SOD1 in neuronal cells (SH-SY5Y) or in immortalized motoneurons (NSC-34). Conversely, the overexpression of Grx2 increases the solubility of mutant SOD1 in mitochondria, interferes with mitochondrial fragmentation by modifying the expression pattern of proteins involved in mitochondrial dynamics, preserves mitochondrial function and strongly protects neuronal cells from apoptosis. The toxicity of mutant SOD1, therefore, mostly arises from mitochondrial dysfunction and rescue of mitochondrial damage may represent a promising therapeutic strategy.


Figures

Figure 1.
Figure 1.
Effect of Grx1 on SOD1 solubility in neuronal cells. (A) Evaluation of enzymatic activity of Grx1 expressed in μmol/NADH/min/mg protein in total extracts from both NSC-34 and SH-SY5Y cells either untransfected or overexpressing Grx1 (upper panel) and the western blot analysis of Grx1 expression levels in the same cell lines (lower panel). Results represent mean ± SD from three independent experiments. Values significantly different from relative controls are indicated with an asterisk when P < 0.01. (B) NSC-34 and SH-SY5Y cells, either untransfected or overexpressing Grx1, were infected with an adenoviral vector leading the transient expression of wild-type SOD1 or G93A-SOD1. The soluble and insoluble protein fractions were collected from cellular lysates and equal amounts of proteins were subjected to a denaturing PAGE as described in Materials and Methods, followed by western blot analysis with an anti-SOD1 antibody. Endogenous mouse SOD1 (mSOD1) serves as an internal loading control. (C) SH-SY5Y cells, either untransfected or overexpressing Grx1, were infected with an adenoviral vector leading the transient expression of wild-type SOD1 or G93A-SOD1. Cells were sub-fractionated on gradients; the soluble and insoluble protein fractions were collected from mitochondrial fractions and subjected to a denaturing PAGE as described in Materials and Methods, followed by western blot analysis with an anti-SOD1 antibody. The blot shown is representative of three independent experiments.
Figure 2.
Figure 2.
Effect of Grx1 on neuronal cells viability. SH-SY5Y cells, either untransfected or overexpressing Grx1, were infected with an adenoviral vector leading the transient expression of wild-type SOD1 or G93A-SOD1. Cells were labeled with an antibody recognizing the active fragment of caspase-3 and the percentage of positive cells was determined and reported as the mean ± SD of three independent experiments. In all, 100 cells were analyzed in each examined field and three randomly chosen fields for each experimental condition were counted. Values significantly different from relative controls are indicated with an asterisk when P < 0.01. (B) Caspase-3 activity as determined by a fluorescence enzymatic assay and reported in arbitrary fluorescence units (mean ± SD of three independent experiments). Values significantly different from relative controls are indicated with an asterisk when P < 0.01 (n = 3). The same cell lines were analyzed in western blot for cleaved (active) PARP expression; lamin B served as the internal loading control. (C) Cell viability was assessed by an MTS assay. Absorbances at 490 nm are expressed as percent of the relative untreated control cells and reported as the mean ± SD of three independent experiments. Values significantly different from relative controls are indicated with an asterisk when P < 0.01.
Figure 3.
Figure 3.
Effect of Grx2 on SOD1 solubility in neuronal cells. (A) Evaluation of enzymatic activity of Grx2 in NSC-34 and SH-SY5Y cells, either untransfected or overexpressing Grx2. Activity was determined on the mitochondrial fraction and is expressed in μmol/NADH/min/mg protein and reported as the mean ± SD of three independent experiments. Values significantly different from relative controls are indicated with an asterisk when P < 0.01. (B) NSC-34 and SH-SY5Y cells, either untransfected or overexpressing Grx2, were infected with an adenoviral vector leading the transient expression of wild-type SOD1 or G93A-SOD1. Total SOD1 was determined by the western blot analysis. β-Actin served as the loading control in extracts from SH-SY5Y-derived cells, whereas endogenous mouse SOD1 (mSOD1) served as the control in extracts from NSC-34-derived cells. The blots shown are representative of three independent experiments. (C) SH-SY5Y cells, either untransfected or overexpressing Grx2, were infected with an adenoviral vector leading the transient expression of wild-type SOD1 or G93A-SOD1. The soluble and insoluble protein fractions were collected from cellular lysates and subjected to a denaturing PAGE as described in Materials and Methods, followed by the western blot analysis with an anti-SOD1 antibody. The blot shown is representative of three independent experiments. (D) SH-SY5Y cells (left) and NSC-34 cells (right), either untransfected or overexpressing Grx2, were infected with an adenoviral vector leading the transient expression of wild-type SOD1 or G93A-SOD1. Cells were sub-fractionated on gradients; the soluble and insoluble protein fractions were collected from mitochondrial fractions and subjected to a denaturing PAGE as described in Materials and Methods, followed by the western blot analysis with an anti-SOD1 antibody. The blots shown are representative of five independent experiments.
Figure 4.
Figure 4.
Effect of Grx2 on mitochondrial morphology. Top panel: NSC-34 cells expressing the cDNA encoding G93A mutSOD1 under control of the inducible Tet-On promoter as described in Materials and Methods and transfected with a plasmid coding for mitochondrial Grx2 were stained with an antibody recognizing the mitochondrial enzyme SOD2 (green) and an antibody against Grx2 (red). (A) and (B) are enlargements of the corresponding insets. Bottom panel: SH-SY5Y cells, either untransfected or stably overexpressing Grx2, were infected as indicated with an adenoviral vector leading the expression of SOD1 (wild-type or mutant G93A-SOD1). Staining: SOD2 (red) and Hoechst (nuclei).
Figure 5.
Figure 5.
Effect of Grx2 on mitochondrial ultrastructure. Electron microscopic analysis of mitochondrial structure in SH-SY5Y cells either untransfected (SH-SY5Y) or expressing Grx2 (SH-SY5Y-Grx2). Cells were infected as indicated with an adenoviral vector leading the expression of SOD1 (wild-type or mutant G93A-SOD1). Ctrl, uninfected SH-SY5Y-Grx2. Arrows indicate swollen mitochondria and arrowheads indicate lysosomes.
Figure 6.
Figure 6.
Effect of Grx2 on the expression of proteins controlling mitochondrial dynamics. NSC-34 (top) and SH-SY5Y (bottom) cells, either untransfected or overexpressing Grx2, were infected with an adenoviral vector leading the transient expression of wild-type SOD1 or G93A-SOD1. Lysates from crude mitochondrial fractions were analyzed in western blot for total OPA1 and DRP1 expression levels. The mitochondrial protein VDAC1 was used as the loading control.
Figure 7.
Figure 7.
Effect of Grx2 on OPA1 expression in neuronal cells. SH-SY5Y cells, either untransfected or overexpressing Grx2, were infected with an adenoviral vector leading the transient expression of wild-type SOD1 or G93A-SOD1. (A) The cell lines were stained with antibodies recognizing the mitochondrial enzyme SOD2 (red) and OPA1 (green). Nuclei were stained with Hoechst 33342. (B) The proportion of OPA1 positive cells was scored (mean ± SD of three independent experiments). For each experimental condition, about 100 cells were counted in each of three randomly chosen fields. Values significantly different from relative controls are indicated with an asterisk when P < 0.01 (n = 3).
Figure 8.
Figure 8.
Effect of Grx2 on DRP1 activation in neuronal cells. SH-SY5Y cells, either untransfected or overexpressing Grx2, were infected with an adenoviral vector leading the transient expression of wild-type SOD1 or G93A-SOD1. (A) Cells were stained with antibodies recognizing the mitochondrial enzyme cytochrome c (green) and the active form of DRP1 (phospho-DRP1, red). Nuclei were stained with Hoechst 33342. (B) The proportion of phospho-DRP1 positive cells was scored (mean ± SD of three independent experiments). For each experimental condition, about 100 cells were counted in each of three randomly chosen fields. Values significantly different from relative controls are indicated with an asterisk when P < 0.01 (n = 3).
Figure 9.
Figure 9.
Effect of Grx2 on mitochondrial metabolism in neuronal cells. Crude mitochondrial fractions were prepared from SH-SY5Y cells either untransfected or overexpressing Grx2 and infected with an adenoviral vector leading the transient expression of wild-type SOD1 or G93A-SOD1. (A) The activity of electron transport chain complexes I (left) and IV (right) was measured by spectrophotometric assays, normalized for protein content and expressed in nmol/min/mg. Values significantly different from relative controls are indicated with an asterisk when P < 0.01 (n = 3). (B) Top: western blot analysis of PINK1 expression levels. The mitochondrial protein VDAC was used as the loading control. One representative blot out of three is shown. Bottom: western blot analysis of active LC3 expression levels. β-Actin was used as the loading control. (C) Mitochondrial GSH/GSSG ratio. Note that the scale bar for cell expressing Grx2 (right) is different from that for untransfected cells (left).
Figure 10.
Figure 10.
Effect of Grx2 on neuronal viability. (A) SH-SY5Y cells either untransfected or overexpressing Grx2 and infected with an adenoviral vector leading the transient expression of wild-type SOD1 or G93A-SOD1. Left panel: quantitative analysis of the numbers of caspase-3 positive cells, immunolabeled with an antibody recognizing the active fragment of caspase-3. For each experimental condition, about 100 cells were counted in each of three randomly chosen fields. Values are mean ± SD of three independent experiments; values significantly different from relative controls are indicated with an asterisk when P < 0.01. Center panel: determination of caspase-3 activity expressed in AFU (arbitrary fluorescence units) × 105 (mean ± SD). Values significantly different from relative controls are indicated with an asterisk when P < 0.01. Right panel: cell viability as assessed by an MTS assay. Absorbances at 490 nm (mean ± SD of three independent experiments) are expressed as percent of the relative untreated control cells. Values significantly different from relative controls are indicated with an asterisk when P < 0.01. (B) Western blot analysis for cleaved (active) PARP expression. Lamin serves as the loading control. Values significantly different from relative controls are indicated with an asterisk when P < 0.01 (n = 3). (C) Expression of Grx2 as measured by real-time RT–PCR on total RNA extracted from control SH-SY5Y cells (Ctrl), SH-SY5Y cells engineered for Grx2 downregulation (siGrx2) or with a random sequence that has no homology with any human transcript (siRandom). Values significantly different from relative controls are indicated with an asterisk when P < 0.01 (n = 3). (D) Top: caspase-3 activity in SH-SY5Y cells, either untransfected or overexpressing Grx2, infected with an adenoviral vector leading the transient expression of wild-type SOD1 or G93A-SOD1 and engineered for Grx2 downregulation, as indicated. AFU = arbitrary fluorescence units (mean ± SD). Values significantly different from relative controls are indicated with an asterisk when P < 0.01 (n = 3). Bottom: western blot analysis for cleaved (active) PARP expression. Values significantly different from relative controls are indicated with an asterisk when P < 0.01 (n = 3).

Similar articles

Cited by

References

    1. Cozzolino M., Ferri A., Carri M.T. Amyotrophic lateral sclerosis: from current developments in the laboratory to clinical implications. Antioxid. Redox Signal. 2008;10:405–443. doi:10.1089/ars.2007.1760. - DOI - PubMed
    1. Chattopadhyay M., Valentine J.S. Aggregation of copper-zinc superoxide dismutase in familial and sporadic ALS. Antioxid. Redox Signal. 2009;11:1603–1614. doi:10.1089/ars.2009.2536. - DOI - PMC - PubMed
    1. Ferri A., Cozzolino M., Crosio C., Nencini M., Casciati A., Gralla E.B., Rotilio G., Valentine J.S., Carri M.T. Familial ALS-superoxide dismutases associate with mitochondria and shift their redox potentials. Proc. Natl Acad. Sci. USA. 2006;103:13860–13865. doi:10.1073/pnas.0605814103. - DOI - PMC - PubMed
    1. Cozzolino M., Pesaresi M.G., Amori I., Crosio C., Ferri A., Nencini M., Carri M.T. Oligomerization of mutant SOD1 in mitochondria of motoneuronal cells drives mitochondrial damage and cell toxicity. Antioxid. Redox Signal. 2009;11:1547–1558. doi:10.1089/ars.2009.2545. - DOI - PubMed
    1. Hurd T.R., Filipovska A., Costa N.J., Dahm C.C., Murphy M.P. Disulphide formation on mitochondrial protein thiols. Biochem. Soc. Trans. 2005;33:1390–1393. doi:10.1042/BST20051390. - DOI - PubMed

Publication types

MeSH terms