. 2010:2:697-707.
doi: 10.1093/gbe/evq054. Epub 2010 Sep 9.

Correlating gene expression variation with cis-regulatory polymorphism in Saccharomyces cerevisiae

Correlating gene expression variation with cis-regulatory polymorphism in Saccharomyces cerevisiae

Kevin Chen et al. Genome Biol Evol. 2010.

Abstract

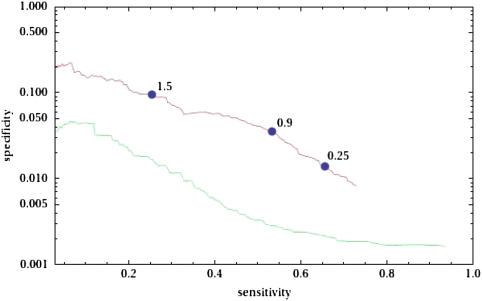
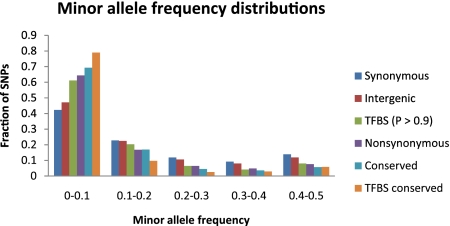
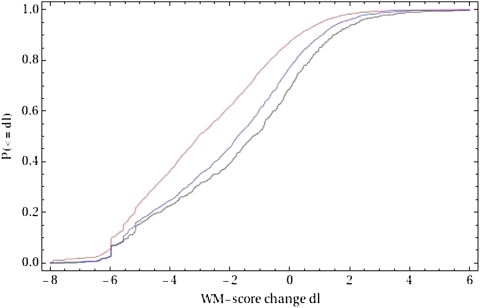
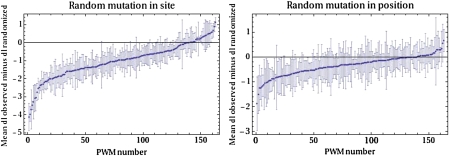
Identifying the nucleotides that cause gene expression variation is a critical step in dissecting the genetic basis of complex traits. Here, we focus on polymorphisms that are predicted to alter transcription factor binding sites (TFBSs) in the yeast, Saccharomyces cerevisiae. We assembled a confident set of transcription factor motifs using recent protein binding microarray and ChIP-chip data and used our collection of motifs to predict a comprehensive set of TFBSs across the S. cerevisiae genome. We used a population genomics analysis to show that our predictions are accurate and significantly improve on our previous annotation. Although predicting gene expression from sequence is thought to be difficult in general, we identified a subset of genes for which changes in predicted TFBSs correlate well with expression divergence between yeast strains. Our analysis thus demonstrates both the accuracy of our new TFBS predictions and the feasibility of using simple models of gene regulation to causally link differences in gene expression to variation at individual nucleotides.
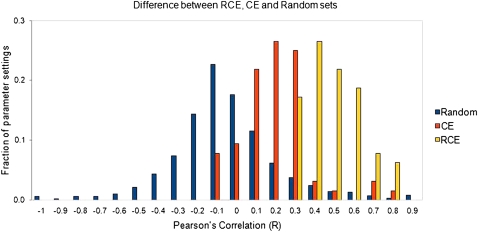

Figures

F<sc>IG</sc>. 1.—
FIG. 1.—
Sensitivity and specificity on a reference set of experimentally verified TFBSs of the target promoters predicted by MotEvo (red) and by the ChIP-chip data of Harbison et al. (2004) (green). All putative interactions between TFs and target promoters were sorted by significance (P-value of binding for the ChIP-chip data and predicted number of sites for MotEvo). By varying the cut-off on the significance, we determined how the specificity of the predictions (the fraction of all predictions that correspond to known TF-promoter interactions) depends on their sensitivity (the fraction of all known TF-promoter interactions that are among the predictions. The vertical axis is shown on a logarithmic scale. The blue dots on the red curve show the sensititivies and specificities obtained when the MotEvo predictions are cutoff at 0.25, 0.9 and 1.5 predicted sites (i.e. total posterior probability) in the promoter.
F<sc>IG</sc>. 2.—
FIG. 2.—
MAF distributions in different classes of sites across the genome. The distribution is shown as the fraction of SNPs in each MAF bin for each class of sites, as indicated.
F<sc>IG</sc>. 3.—
FIG. 3.—
Reverse-cumulative distribution of the changes in PWM scores induced by SNPs in predicted TFBSs. For all predicted TFBS in the BY strain with a single SNP in the RM strain, the difference in log-likelihood (dl) of the sequences for the corresponding PWM was determined (black line). For comparison, the red line shows the reverse-cumulative distribution of log-likelihood differences (dl) that would be obtained by randomly mutating a single position in the same TFBS. The blue line shows the analogous distribution for random mutations in the same position in the TFBS as the observed SNPs.
F<sc>IG</sc>. 4.—
FIG. 4.—
Effects of random mutations on PWM scores. For each TF, the difference between the average PWM score change (dl) induced by the observed SNPs and the average PWM score change (dl) induced by random mutations is shown, both for random mutations at any position in the TFBS (left panel) and random mutations at the same position as the observed SNP (right panel). The error bars show the standard errors for these differences in mean PWM score change. In each panel, the TFs are ordered from left to right by the difference of means.
F<sc>IG</sc>. 5.—
FIG. 5.—
Correlation of change in gene expression with change in PWM score. The Pearson correlation of the absolute log fold change of mRNA expression with the absolute value of the change in PWM score was computed for a range of values of the promoter region length, posterior probability cutoff, and fold change cutoff. The fraction of these parameter settings with a given correlation coefficient is shown as a histogram for randomized (blue), CE (orange), or RCE genes (yellow).

References

    1. Altshuler D, Daly M, Lander E. Genetic mapping in human disease. Science. 2008;322:881–888. - PMC - PubMed
    1. Andersen M, et al. In silico detection of sequence variations modifying transcriptional regulation. PLoS Comput Biol. 2008;4:e5. - PMC - PubMed
    1. Badis G, et al. A library of yeast transcription factor motifs reveals a widespread function for Rsc3 in targeting nucleosome exclusion at promoters. Mol Cell. 2008;32:878–887. - PMC - PubMed
    1. Badis G, et al. Diversity and complexity in DNA recognition by transcription factors. Science. 2009;324:1720–1723. - PMC - PubMed
    1. Berriz G, Beaver J, Cenik C, Tasan M, Roth F. Next generation software for functional trend analysis. Bioinformatics. 2009;25:3043–3044. - PMC - PubMed

Publication types

MeSH terms

Substances