. 2010 Dec 1;16(23):5664-78.
doi: 10.1158/1078-0432.CCR-10-1564. Epub 2010 Sep 9.

Heterogeneous blood-tumor barrier permeability determines drug efficacy in experimental brain metastases of breast cancer

Affiliations

Heterogeneous blood-tumor barrier permeability determines drug efficacy in experimental brain metastases of breast cancer

Paul R Lockman et al. Clin Cancer Res. .

Abstract

Purpose: Brain metastases of breast cancer appear to be increasing in incidence, confer significant morbidity, and threaten to compromise gains made in systemic chemotherapy. The blood-tumor barrier (BTB) is compromised in many brain metastases; however, the extent to which this influences chemotherapeutic delivery and efficacy is unknown. Herein, we answer this question by measuring BTB passive integrity, chemotherapeutic drug uptake, and anticancer efficacy in vivo in two breast cancer models that metastasize preferentially to brain.

Experimental design: Experimental brain metastasis drug uptake and BTB permeability were simultaneously measured using novel fluorescent and phosphorescent imaging techniques in immune-compromised mice. Drug-induced apoptosis and vascular characteristics were assessed using immunofluorescent microscopy.

Results: Analysis of over 2,000 brain metastases from two models (human 231-BR-Her2 and murine 4T1-BR5) showed partial BTB permeability compromise in greater than 89% of lesions, varying in magnitude within and between metastases. Brain metastasis uptake of ¹⁴C-paclitaxel and ¹⁴C-doxorubicin was generally greater than normal brain but less than 15% of that of other tissues or peripheral metastases, and only reached cytotoxic concentrations in a small subset (∼10%) of the most permeable metastases. Neither drug significantly decreased the experimental brain metastatic ability of 231-BR-Her2 tumor cells. BTB permeability was associated with vascular remodeling and correlated with overexpression of the pericyte protein desmin.

Conclusions: This work shows that the BTB remains a significant impediment to standard chemotherapeutic delivery and efficacy in experimental brain metastases of breast cancer. New brain permeable drugs will be needed. Evidence is presented for vascular remodeling in BTB permeability alterations.


Figures

Figure 1
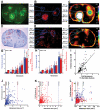
Figure 1. Experimental brain metastases of breast cancer exhibit heterogeneous passive permeability with weak correlation to lesion size
(A and D) Representative images of metastases of A: eGFP-transfected 231-BR-Her2 or D: 4T1-BR5 cells (cresyl violet staining), respectively. B-C and E-F: Images of the same brain section showing metastases and brain accumulation of Texas Red 3kDa dextran and 14C-AIB with vascular washout. White scale bar represents 1 mm. The fold increase (mean ± SD) in 14C-AIB (blue bars) and TX Red 3kDa dextran (red bars) PS is shown between brain and 231-BR-Her2 brain metastases (G) and 4T1-BR5 brain metastases (H). Metastases were separated into four groups based upon the magnitude of the permeability change compared to mean brain. Values represent the percent of metastases in each group, and the mean fold increase of tracer in each group. I: Fold increase 14C-AIB (over normal brain) plotted versus fold increase Texas Red 3kDa dextran in 231-BR-Her2 metastases. r2=0.54, P<0.0001 (n=127). J and K: Fold elevation of 14C-AIB (blue dots; n=288) and Texas Red 3kDa dextran (red dots; n=535) in individual 231-BR-Her2 brain metastases compared to brain distant from tumor graphed versus metastasis size (mm2). Brain distant from tumor equals 1.0 and is represented by the horizontal line. Diameter in one plane is shown in vertical lines. L: Fold elevation of metastasis 14C-AIB (blue dots) and Texas Red 3kDa dextran (red dots) versus metastasis size in 4T1-BR5 (n=229).
Figure 2
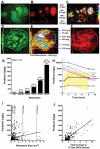
Figure 2. Variable paclitaxel uptake in 231-BR-Her2 brain metastases that correlates with Texas Red 3kDa dextran accumulation
14C-Paclitaxel distribution in 231-BR-Her2 metastases after intravenous administration of 10 mg/kg paclitaxel (Taxol formulation). Distribution of A: EGFP, B: Texas Red 3kDa dextran (10 min circulation), and C: 14C-paclitaxel (8 hr); followed by a 30 s vascular washout. White scale bar represents 1 mm. Heterogeneous distribution is shown within one representative brain metastasis (D: EGFP; E: 14C-paclitaxel; F: Texas Red 3kDa dextran). G: 14C-Paclitaxel concentration (ng/g) in brain and 231-BR-Her2 brain metastases. Values represent the percent of all metastases in each group, and the mean ± SD 14C-paclitaxel concentration in each group. H: Mean brain metastasis drug concentration was measured at different times (30 min-8 hrs) and related to that in brain distant from tumor, plasma, blood, and peripheral tissues (n=3 animals per point). Yellow areas show highest and lowest concentrations observed in brain metastases at the three time points. Calculated area under the curve cumulative exposure (in μg.hr/g) equaled 0.18 in brain, 2.9 in average brain metastasis, and 80-400 in peripheral tissues. I: The 14C-paclitaxel concentration versus lesion size of individual metastasis are graphed for 231-BR-Her2. Correlation was minimal between brain metastasis paclitaxel concentration and lesion size (Pearson r2=0.037). Dashed lines represent diameter. J: Correlation of 14C-paclitaxel concentration versus fold increase of Texas Red 3kDa dextran permeability of individual metastases. An appreciable correlation of paclitaxel concentration to Texas Red 3kDa dextran was noted (Pearson r2=0.605, P<0.0001, n=354).
Figure 3
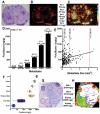
Figure 3. Variable paclitaxel uptake in 4T1-BR5 brain metastases of breast cancer
A-C: 14C-Paclitaxel distribution in representative 4T1-BR5 brain metastases. TX Red 3kDa permeability marker circulated for 10 min whereas 10 mg/kg 14C-paclitaxel circulated for 30 min (after circulation of both tracers there was a 30 s vascular washout) A: Bright field image of cresyl violet stained lesions. B: Texas Red 3kDa dextran uptake (White scale bar represents 1 mm). C: 14C-Paclitaxel concentration. D: 14C-Paclitaxel concentration (ng/g) in brain and 4T1-BR5 brain metastases. E: 14C-Paclitaxel concentration versus lesion size of individual metastases. Correlation was minimal between brain metastasis paclitaxel concentration and lesion size (Pearson r2=0.034). Dashed lines represent diameter. F: 14C-paclitaxel distribution (30 min) in 4T1-BR5 metastases in brain and peripheral tissues, as well as in matching surrounding normal tissues. The distribution of individual data points for brain and peripheral tissues are shown as well as the mean. N=3 mice. G: Representative section showing cresyl violet stained 4T1-BR5 kidney metastases: H: 14C-paclitaxel concentration in kidney section.
Figure 4
Figure 4. Positive cleaved caspase-3 staining in brain metastases with high paclitaxel accumulation
Representative images of A: high (representing <10% of lesions) and D: low 14C-paclitaxel uptake in 231-BR-Her2 experimental metastases. Presence of cleaved caspase-3 staining (red) was found in human cytokeratin positive tumor cells (green) within brain metastases with markedly elevated paclitaxel concentration (B-C), but not in metastases with low paclitaxel concentration (E-F). N=3-5 animals per group.
Figure 5
Figure 5. Heterogeneous doxorubicin uptake in 231-BR-Her2 brain metastases of breast cancer
14C-Doxorubicin distribution in representative images for 231-BR-Her2 (A-C) and 4T1BR5 (D-F) brain metastases. TX Red 3kDa permeability marker circulated for 10 min whereas 6 mg/kg 14C-doxorubicin circulated for 30 min; followed by a 30 s vascular washout. A: EGFP imaging. D: Cresyl violet staining, B and E: Texas Red 3kDa dextran uptake. C and F: 14C-Doxorubicin uptake. G: 14C-Doxorubicin concentration versus lesion size of individual metastases. Correlation was minimal between brain metastasis doxorubicin concentration and lesion size (Pearson r2=0.070). Dashed lines represent diameter. H: 14C-Doxorubicin correlated appreciably with fold increase in Texas Red 3kDa dextran permeability (Pearson r2=0.591, P<0.0001, n=54). Serum 14C was shown to be >95% intact 14C-doxorubicin at 30 min of circulation using HPLC. I: 14C-Doxorubicin concentration (ng/g) in brain and 231-BR-Her2 brain metastases. Metastases were separated into five groups based upon the magnitude of the 14C-doxorubicin concentration relative to normal brain. Values represent the percent of all metastases in each group, and the mean ± SD 14C-doxorubicin concentration in each group.
Figure 6
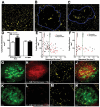
Figure 6. Vascular density is reduced and does not correlate with BTB permeability in two experimental models of brain metastasis of breast cancer
Representative images of the vascular density of A: normal brain, B: 231-BR-Her2, and C: 4T1-BR5 metastases (capillaries, yellow; metastasis boundary, blue). D: Calculated vascular densities of both permeable and non-permeable metastases. E and F: Vascular density and metastasis size for permeable and nonpermeable tumors. E: 231-BR-Her2. F: 4T1-BR5. Data were obtained by injection and circulation of 14C-AIB (10 min) and indocyanine green (1 min) bound to albumin as the vascular tracer. Elevated BTB permeability was not associated with increased vascular density either by analysis of linear regression slopes or intercepts (P>0.05). Representative images showing simultaneous multi-channel quantitative imaging of eGFP (G and K), 14C-AIB by phosphorescent imaging (H and L), vascular density by near infrared imaging of indocyanine green (I and M) of a permeable (G-J) and non-permeable lesion (K-N); J and N are combined multichannel images.
Figure 7
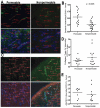
Figure 7. Passive permeability of experimental brain metastases is associated with blood-tumor barrier remodeling
A: BTB permeability is associated with desmin overexpression by immunoflourescent staining. Representative images of desmin staining in adjacent permeable and nonpermeable metastases from the same brain. CD31 (capillaries, red), desmin (green) and DAPI (nuclei, blue). B: Desmin expression per CD31+ area plotted for 35 permeable and nonpermeable metastases. Mean values are indicated as lines. Expression intensity was ~2 fold elevated in permeable versus nonpermeable metastases (P=0.0005, Mann-Whitney test). C: Representative section stained for type IV collagen (green). Other colors same as A. D-E: Plotted data for type IV collagen and ABCB1 (P>0.05).

Comment in

References

    1. Lin N, Bellon J, Winer E. CNS metastases in breast cancer. J Clin Oncol. 2004;22:3608–17. - PubMed
    1. Weil R, Palmieri D, Bronder J, Stark A, Steeg P. Breast cancer metastasis to the central nervous system. Am J Pathol. 2005;167:913–20. - PMC - PubMed
    1. Lin NU, Winer EP. Brain metastases: the HER2 paradigm. Clin Cancer Res. 2007;13:1648–55. - PubMed
    1. Pestalozzi BC, Zahrieh D, Price KN, Holmberg SB, Lindtner J, Collins J, et al. Identifying breast cancer patients at risk for Central Nervous System (CNS) metastases in trials of the International Breast Cancer Study Group (IBCSG) Ann Oncol. 2006;17:935–44. - PubMed
    1. Shmueli E, Wigler N, Inbar M. Central nervous system progression among patients with metastatic breast cancer responding to trastuzumab treatment. Eur J Cancer. 2004;40:379–82. - PubMed

Publication types

MeSH terms