. 2010 Nov 19;285(47):37082-91.
doi: 10.1074/jbc.M110.152033. Epub 2010 Sep 9.

Structural basis for the cAMP-dependent gating in the human HCN4 channel

Affiliations

Structural basis for the cAMP-dependent gating in the human HCN4 channel

Xinping Xu et al. J Biol Chem. .

Abstract

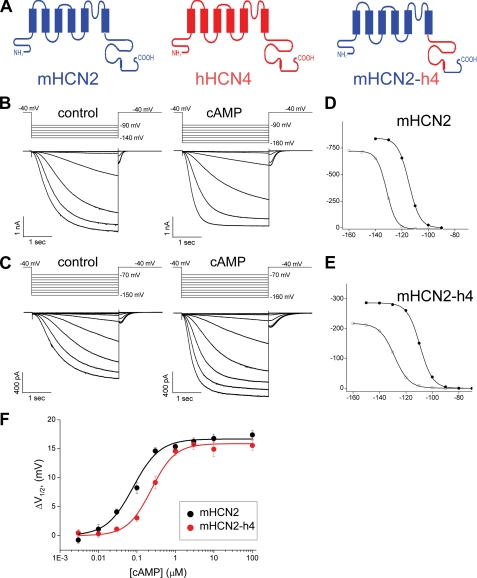
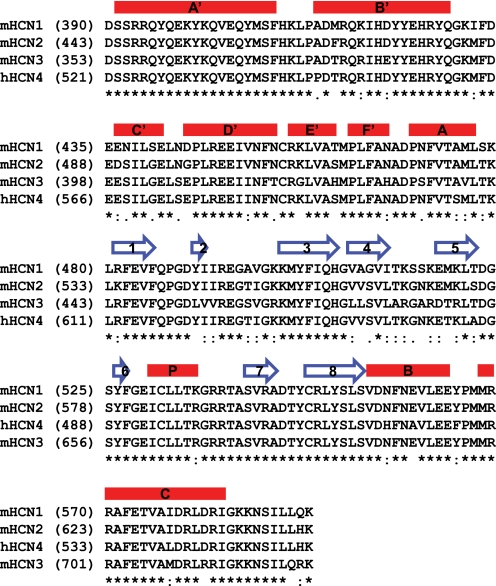
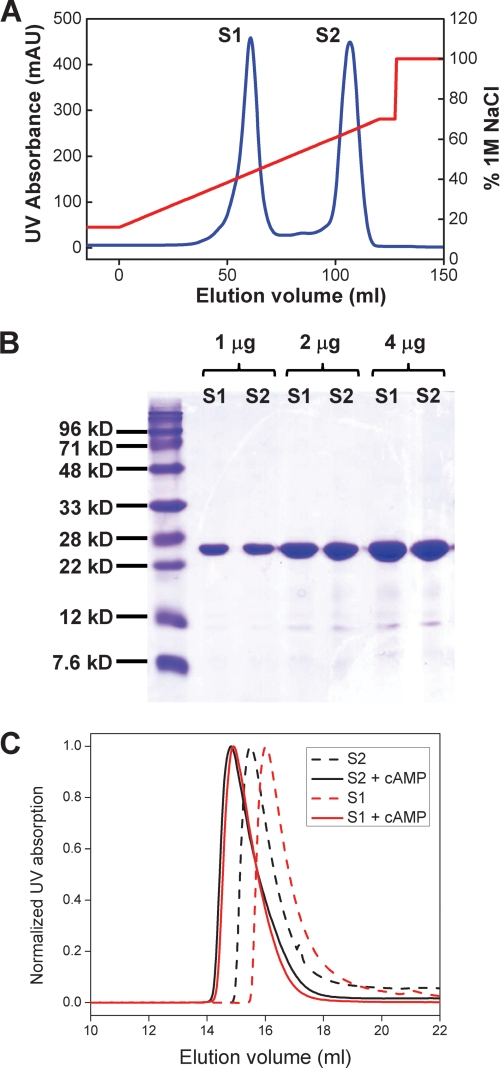
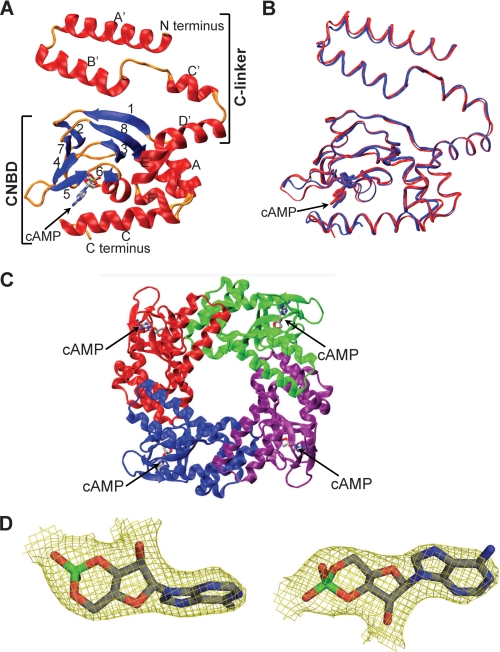
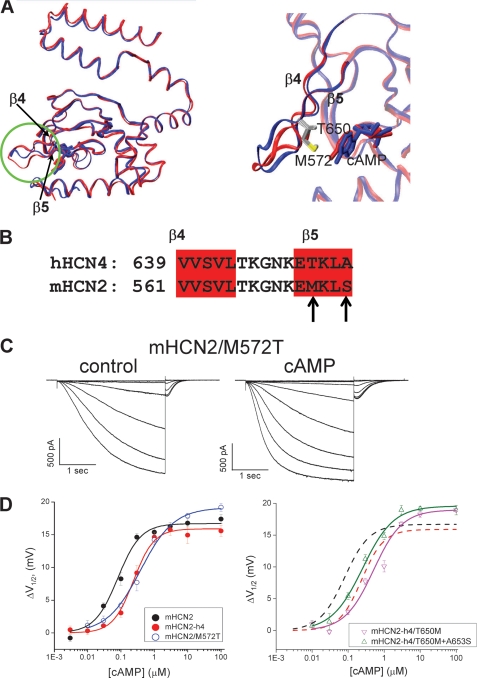
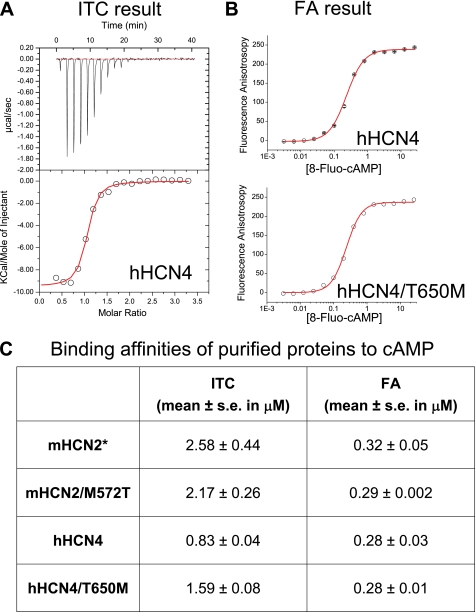
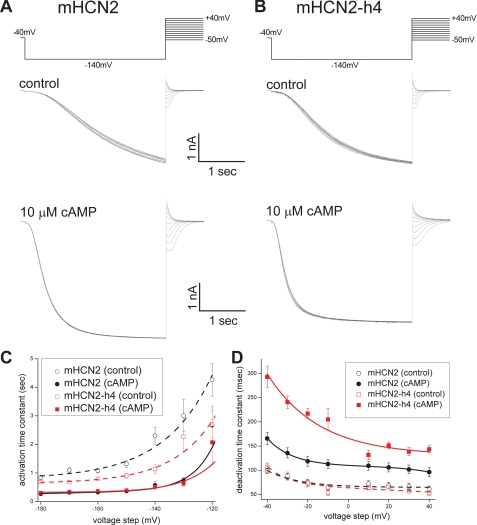
Hyperpolarization-activated cAMP-regulated (HCN) channels play important physiological roles in both cardiovascular and central nervous systems. Among the four HCN isoforms, HCN2 and HCN4 show high expression levels in the human heart, with HCN4 being the major cardiac isoform. The previously published crystal structure of the mouse HCN2 (mHCN2) C-terminal fragment, including the C-linker and the cyclic-nucleotide binding domain (CNBD), has provided many insights into cAMP-dependent gating in HCN channels. However, structures of other mammalian HCN channel isoforms have been lacking. Here we used a combination of approaches including structural biology, biochemistry, and electrophysiology to study cAMP-dependent gating in HCN4 channel. First we solved the crystal structure of the C-terminal fragment of human HCN4 (hHCN4) channel at 2.4 Å. Overall we observed a high similarity between mHCN2 and hHCN4 crystal structures. Functional comparison between two isoforms revealed that compared with mHCN2, the hHCN4 protein exhibited marked different contributions to channel function, such as a ∼3-fold reduction in the response to cAMP. Guided by structural differences in the loop region between β4 and β5 strands, we identified residues that could partially account for the differences in response to cAMP between mHCN2 and hHCN4 proteins. Moreover, upon cAMP binding, the hHCN4 C-terminal protein exerts a much prolonged effect in channel deactivation that could have significant physiological contributions.


Figures

FIGURE 1.
FIGURE 1.
Construction and characterization of the mHCN2-h4 chimeric channel. A, construction of the mHCN2-h4 channel by swapping the C-linker and CNBD region from human HCN4 (red) to mouse HCN2 channel (blue). B, macroscopic currents of mouse HCN2 in response to a series of hyperpolarizing voltage steps in 10-mV intervals. Voltage steps used are shown in the top. Left, control without cAMP; right, 10 μm cAMP applied to the intracellular side. C, macroscopic currents of mHCN2-h4. Voltage steps used are shown in the top. Left, control without cAMP; right, 10 μm cAMP. D, voltage-dependent channel activation curve for mHCN2 channel based on the tail currents measured from the recordings shown in B. Open circle, control no cAMP; filled circle, 10 μm cAMP applied to the intracellular side. E, voltage-dependent channel activation curve for mHCN2-h4 channel based on the recordings shown in C. Open circle, control no cAMP; filled circle, 10 μm cAMP. F, dose-response curves showing the shift in the voltage-dependent channel activation curve (ΔV½) as a function of cAMP concentration (black, mHCN2; red, mHCN2-h4).
FIGURE 2.
FIGURE 2.
Primary sequence alignment in the C-linker and CNBD region from representative HCN channels. Protein primary sequences for the C-linker and CNBD region from the mouse HCN1–3 channels and human HCN4 channel were aligned by ClustalW (45). Secondary structures are labeled on the top of the sequence. Red bar, α-helix; blue arrow, β-strand.
FIGURE 3.
FIGURE 3.
Purification and biochemical characterization of the hHCN4C protein. A, elution profile of the hHCN4C protein from the ion-exchange HiTrap S column. Blue trace, UV absorbance (left y axis); red trace, the percentage of buffer B (1 m NaCl, right y axis). The two UV absorbance peaks are labeled S1 and S2, respectively. B, SDS-PAGE of purified hHCN4 S1 and S2 fractions. 1, 2, and 4 μg of S1 and S2 were loaded on the gel, and stained with Coomassie Blue. C, elution profiles of S1 (red) and S2 (black) fractions on the Superdex 200 10/30 size exclusion column. Dashed lines, control without cAMP; solid lines, 5 μm cAMP.
FIGURE 4.
FIGURE 4.
Crystal structure of the human HCN4 C terminus and alignment with the mouse HCN2 structure. A, ribbon diagram of the hHCN4C structure. The regions of C-linker and CNBD are labeled. The cAMP molecule has sticks for bonds. B, superposition of hHCN4C with mHCN2C based on C-α atoms. hHCN4C is red and mHCN2C is blue. The cAMP molecule has sticks for bonds. C, ribbon diagram of the hHCN4C tetramer. A tetrameric assembly was built based on crystallographic symmetry. Each subunit is shown in a different color, and the tetramer is viewed parallel to the 4-fold axis, presumably from the cell membrane into the intracellular side. D, electron density of the cAMP molecule in the hHCN4C structure. The model-phased (2|Fo| − |Fc|) electron density map of cAMP was drawn as yellow three-dimensional baskets contoured at σ level 1.0 after refinement at 2.4-Å resolution. The cAMP molecule has sticks for bonds.
FIGURE 5.
FIGURE 5.
Point mutation of M572T in mHCN2 diminishes the difference in response to cAMP from hHCN4. A, left, structure alignment of mHCN2C (blue) and hHCN4C (red) monomers. The β4 loop-β5 region is highlighted with a green circle. Right, a zoomed view over the loop region between β4 and β5. B, primary sequence alignment of the β4 loop-β5 region for mHCN2 and hHCN4. The β4 and β5 strands are highlighted in red. The differences in primary sequence are indicated by arrows. C, representative recordings of mHCN2/M572T (left, control; right, 10 μm cAMP). D, dose-response curves showing the shift in the voltage-dependent channel activation curve (ΔV½) versus cAMP concentration for WT mHCN2 (black), mHCN2-h4 (red), mHCN2/M572T (blue), mHCN2-h4/T650M (magenta), and mHCN2-h4/T650M + A653S (green).
FIGURE 6.
FIGURE 6.
Biochemical binding assays on purified HCN C-terminal proteins. A, original ITC data showing the binding of cAMP to WT hHCN4 protein. Top, the rate of heat exchange is plotted as a function of time. Each spike represents injection of cAMP into the sample cell. Bottom, the plot of heat exchange as a function of protein to the cAMP ratio. B, FA results showing the binding of 8-Fluo-cAMP to WT hHCN4 (top) and T650M mutant hHCN4 (bottom) proteins. C, summary of the Kd value obtained from ITC or FA experiments on different protein samples. *, results for the WT mHCN2 protein are listed for comparison purpose.
FIGURE 7.
FIGURE 7.
Effects of cAMP binding on channel opening and closing kinetics in mHCN2 and mHCN2-h4 channels. A, the mHCN2 channel was activated by a voltage step from −40 to −140 mV. Then channel deactivation kinetics were measured at different holding potentials ranging from +40 to −50 mV. Voltage protocol is shown on the top. Recording traces are shown in the middle, control without cAMP; bottom, 10 μm cAMP. B, channel deactivation in the mHCN2-h4 channel. Voltage protocol is shown at the top. Middle, control without cAMP; bottom, 10 μm cAMP. C, voltage-dependent channel activation kinetics. A series of hyperpolarizing voltage steps as used in Fig. 1, B and C, were used to activate mHCN2 (black) and mHCN2-h4 (red) to difference levels. Open circle and the dashed line represent the conditions without cAMP, whereas closed circle and solid line represent the conditions with cAMP. D, voltage-dependent channel deactivation kinetics. The voltage protocol and representative current traces are shown in A and B for mHCN2 (black) and mHCN2-h4 (red), respectively. Open circle and dashed line represent the conditions without cAMP, whereas closed circle and solid line represent the conditions with cAMP.

References

    1. Hille B. (2001) Ion Channels of Excitable Membranes, 3rd Ed., Sinauer, Sunderland, MA
    1. Jan L. Y., Jan Y. N. (1990) Nature 345, 672. - PubMed
    1. Zagotta W. N., Siegelbaum S. A. (1996) Annu. Rev. Neurosci. 19, 235–263 - PubMed
    1. Biel M., Wahl-Schott C., Michalakis S., Zong X. (2009) Physiol. Rev. 89, 847–885 - PubMed
    1. Ganetzky B., Robertson G. A., Wilson G. F., Trudeau M. C., Titus S. A. (1999) Ann. N.Y. Acad. Sci. 868, 356–369 - PubMed

Publication types

MeSH terms

Associated data