. 2010 Dec;9(12):2840-52.
doi: 10.1074/mcp.M110.003731. Epub 2010 Sep 9.

The generating function of CID, ETD, and CID/ETD pairs of tandem mass spectra: applications to database search

Affiliations

The generating function of CID, ETD, and CID/ETD pairs of tandem mass spectra: applications to database search

Sangtae Kim et al. Mol Cell Proteomics. 2010 Dec.

Abstract

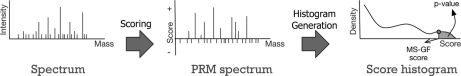
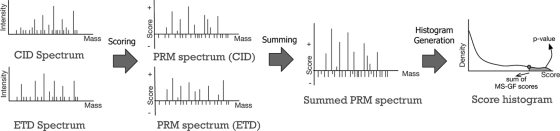
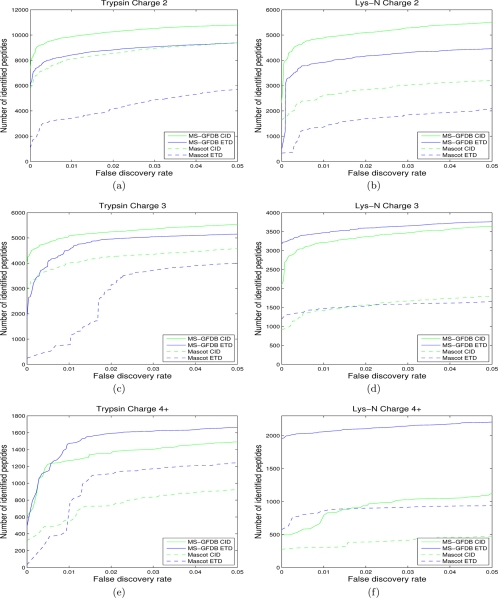
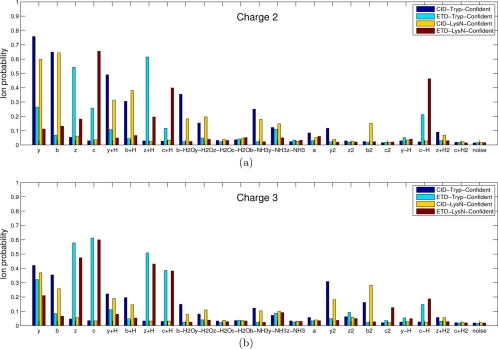
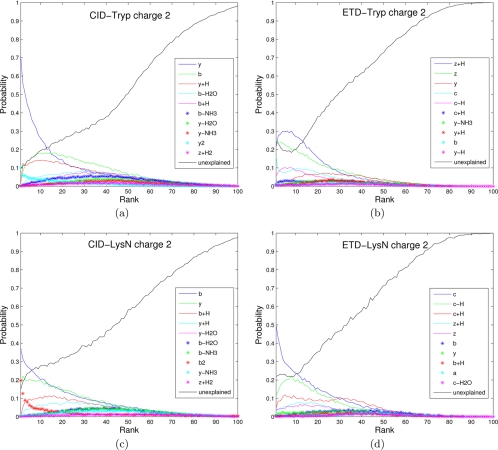
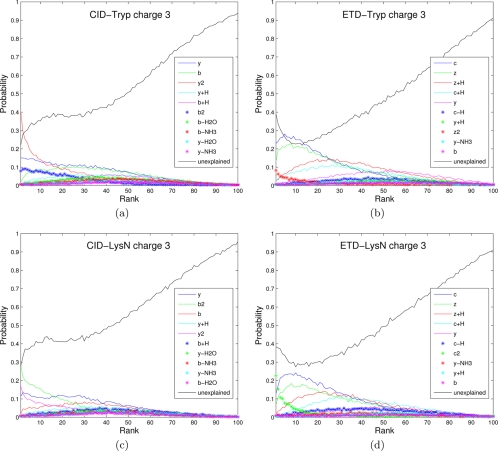
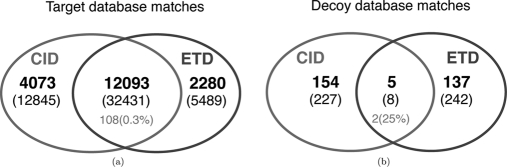
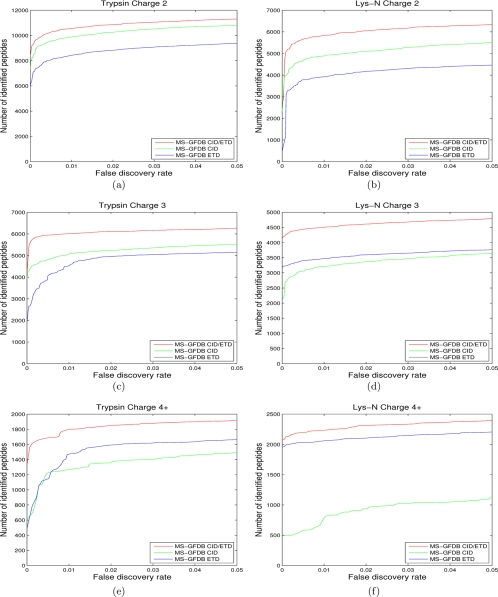
Recent emergence of new mass spectrometry techniques (e.g. electron transfer dissociation, ETD) and improved availability of additional proteases (e.g. Lys-N) for protein digestion in high-throughput experiments raised the challenge of designing new algorithms for interpreting the resulting new types of tandem mass (MS/MS) spectra. Traditional MS/MS database search algorithms such as SEQUEST and Mascot were originally designed for collision induced dissociation (CID) of tryptic peptides and are largely based on expert knowledge about fragmentation of tryptic peptides (rather than machine learning techniques) to design CID-specific scoring functions. As a result, the performance of these algorithms is suboptimal for new mass spectrometry technologies or nontryptic peptides. We recently proposed the generating function approach (MS-GF) for CID spectra of tryptic peptides. In this study, we extend MS-GF to automatically derive scoring parameters from a set of annotated MS/MS spectra of any type (e.g. CID, ETD, etc.), and present a new database search tool MS-GFDB based on MS-GF. We show that MS-GFDB outperforms Mascot for ETD spectra or peptides digested with Lys-N. For example, in the case of ETD spectra, the number of tryptic and Lys-N peptides identified by MS-GFDB increased by a factor of 2.7 and 2.6 as compared with Mascot. Moreover, even following a decade of Mascot developments for analyzing CID spectra of tryptic peptides, MS-GFDB (that is not particularly tailored for CID spectra or tryptic peptides) resulted in 28% increase over Mascot in the number of peptide identifications. Finally, we propose a statistical framework for analyzing multiple spectra from the same precursor (e.g. CID/ETD spectral pairs) and assigning p values to peptide-spectrum-spectrum matches.


Figures

Fig. 1.
Fig. 1.
Computing p values with MS-GF for a single spectrum. Given a tandem mass spectrum, MS-GF converts the spectrum into a PRM spectrum (scored version of the tandem mass spectrum). The score of a PRM spectrum at mass m represents the log likelihood ratio that the peptide from which the spectrum was derived contains a prefix of mass m. Negative peaks in the PRM spectrum represent masses more likely to represent incorrect rather than correct prefix masses. Such negative peaks in the PRM spectrum usually correspond to low-intensity or missing peaks in the experimental spectrum. The PRM spectrum is used to compute the MS-GF score of any peptide against the spectrum. Then, MS-GF computes the histogram of the MS-GF scores of all peptides against the spectrum using the generating function approach. Finally, MS-GF computes the p value of a peptide as the area under the histogram with MS-GF scores equal or larger than the MS-GF score of the peptide.
Fig. 2.
Fig. 2.
Computing p values with MS-GF for CID/ETD pairs. Given a CID/ETD pair, MS-GFDB converts each spectrum into a PRM spectrum and merges two PRM spectra by summing scores of peaks sharing the same mass. This “summed” PRM spectrum is used to generate the score histogram of all peptides and p values are computed using the histogram.
Fig. 3.
Fig. 3.
Number of identified peptides with Mascot and MS-GFDB from (a) charge 2 spectra in CID-Tryp and ETD-Tryp, (b) charge 2 spectra in CID-LysN and ETD-LysN, (c) charge 3 spectra in CID-Tryp and ETD-Tryp, (d) charge 3 spectra in CID-LysN and ETD-LysN, (e) spectra with charges 4 and larger in CID-Tryp and ETD-Tryp, and (f) spectra with charges 4 and larger in CID-LysN and ETD-LysN. The number of peptide identifications is plotted against the corresponding peptide level FDR. Solid curves represent MS-GFDB and dashed curves represent Mascot. Green curves represent CID and blue curves represent ETD. Mascot ion scores and MS-GFDB p values were used for computing FDRs. FDRs were separately computed for spectra of precursor charge 2, precursor charge 3, and precursor charge 4 and larger. For all the cases considered, MS-GFDB outperformed Mascot.
Fig. 4.
Fig. 4.
Probabilities of various ion types for the four types of (a) charge 2 spectra and (b) charge 3 spectra (see (32) for similar analysis). Spectra in CID-Tryp-Confident, ETD-Tryp-Confident, CID-LysN-Confident, and ETD-LysN-Confident were used. All the spectra were filtered to remove noisy peaks as follows: given a peak at mass M, we retained the peak if it is among the top six peaks within a window of size 100 Da around M. Precursor ions (or charge-reduced precursor ions) and their derivatives were also filtered out. A colored bar represents the probability (y axis) of a certain type of ion (x axis) being present in a filtered spectrum. Each data set is color coded. For example, a charge 2 spectrum in CID-Tryp-Confident generated from a length 10 peptide is expected to have 10–1 (number of potential cleavage sites) × 0.76 (probability of y ion) = 6.8 y ions, whereas a charge 2 spectrum in ETD-Tryp-Confident is expected to have only 9 × 0.26 = 2.3 y ions. In MS-GFDB, all ion types with probabilities exceeding 0.15 are used for scoring (see Supplement 1 for details).
Fig. 5.
Fig. 5.
Rank distributions of different ion types for different data sets: a, CID-Tryp-Confident; b, CID-LysN-Confident; c, ETD-Tryp-Confident; and d, ETD-LysN-Confident. Only charge two spectra were considered and all spectra were filtered to remove precursor ions (or charge-reduced precursor ions) and their derivatives. For each data set, 10 different ion types with highest probabilities were selected and the probability of a peak of a given rank (x axis) being a certain ion type (color-coded) is plotted for peaks with rank 1 to 100. The black curve (labeled as unexplained) represents the peaks that are not explained by any of the 10 selected ion types. For example, for CID-Tryp-Confident charge 2, the highest ranked peak represents a singly charged y ion with probability 0.7, a doubly charged y ion (y2) with probability 0.1, a singly charged b ion with probability 0.04, etc. It remains unexplained with probability 0.1.
Fig. 6.
Fig. 6.
Analog of Fig. 5 for charge 3 spectra.
Fig. 7.
Fig. 7.
Venn diagrams of (a) spectral pairs identified against the IPI-Human database within peptide level FDR 1% and (b) spectral pairs identified against the decoy database with p values corresponding to peptide level FDR 1% or less. The number of peptides (the number of spectral pairs in parentheses) are shown. The grey numbers correspond to the number (percentage in parentheses) of spectral pairs where CID and ETD identifications disagree.
Fig. 8.
Fig. 8.
Number of identified peptides with MS-GFDB CID/ETD from (a) charge 2 spectral pairs in CID-Tryp and ETD-Tryp, (b) charge 2 spectral pairs in CID-LysN and ETD-LysN, (c) charge 3 spectral pairs in CID-Tryp and ETD-Tryp, (d) charge 3 spectral pairs in CID-LysN and ETD-LysN, (e) spectral pairs of charges 4 and larger in CID-Tryp and ETD-Tryp, and (f) spectral pairs of charges 4 and larger in CID-LysN and ETD-LysN. Number of identified peptides with MS-GFDB are also shown for reference. The number of peptide identifications is plotted against the corresponding peptide level FDR. FDRs were separately computed for spectra of precursor charge 2, precursor charge 3, and precursor charge 4 and larger. Red curves represent MS-GFDB CID/ETD, green curves represent MS-GFDB CID and blue curves represent MS-GFDB ETD. For all the cases considered, MS-GFDB outperformed both MS-GFDB CID and MS-GFDB ETD.

References

    1. Zubarev R., Kelleher N., McLafferty F. (1998) Electron capture dissociation of multiply charged protein cations. a nonergodic process. J. Am. Chem. Soc. 120, 3265–3266
    1. Cooper H. J., Håkansson K., Marshall A. G. (2005) The role of electron capture dissociation in biomolecular analysis. Mass Spectrom. Rev. 24, 201–222 - PubMed
    1. Syka J. E., Coon J. J., Schroeder M. J., Shabanowitz J., Hunt D. F. (2004) Peptide and protein sequence analysis by electron transfer dissociation mass spectrometry. Proc. Natl. Acad. Sci. U.S.A. 101, 9528–9533 - PMC - PubMed
    1. Taverna S. D., Ueberheide B. M., Liu Y., Tackett A. J., Diaz R. L., Shabanowitz J., Chait B. T., Hunt D. F., Allis C. D. (2007) Long-distance combinatorial linkage between methylation and acetylation on histone h3 n termini. Proc. Natl. Acad. Sci. U.S.A. 104, 2086–2091 - PMC - PubMed
    1. Khidekel N., Ficarro S. B., Clark P. M., Bryan M. C., Swaney D. L., Rexach J. E., Sun Y. E., Coon J. J., Peters E. C., Hsieh-Wilson L. C. (2007) Probing the dynamics of o-glcnac glycosylation in the brain using quantitative proteomics. Nat. Chem. Biol. 3, 339–348 - PubMed

Publication types