Graphic reanalysis of the two NINDS-tPA trials confirms substantial treatment benefit
- PMID: 20829518
- PMCID: PMC2949055
- DOI: 10.1161/STROKEAHA.110.583807
Graphic reanalysis of the two NINDS-tPA trials confirms substantial treatment benefit
Abstract
Background and purpose: Multiple statistical analyses of the 2 NINDS-tPA trials have confirmed study findings of benefit of fibrinolytic therapy. A recent graphic analysis departed from best practices in the visual display of quantitative information by failing to take into account the skewed functional importance of NIH Stroke Scale raw scores and by scaling change axes at up to 20 times the range achievable by individual patients.
Methods: Using the publicly available datasets of the 2 NINDS-tPA trials, we generated a variety of figures appropriate to the characteristics of acute stroke trial data.
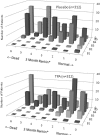
Results: A diverse array of figures all visually delineated substantial benefits of fibrinolytic therapy, including: bar charts of normalized gain and loss; stacked bar, bar, and matrix plots of clinically relevant ordinal ranks; a time series stacked line plot of continuous scale disability weights; and line plot, bubble chart, and person icon array graphs of joint outcome table analysis. The achievable change figure showed substantially greater improvement among tPA than placebo patients, median 66.7% (interquartile range, 0 to 92.0) versus 50.0% (interquartile range, -7.1 to 80.0), P=0.003.
Conclusions: On average, under 3 hour patients treated with tPA recovered two-thirds while placebo patients improved only half of the way toward fully normal. Graphical analyses of the 2 NINDS-tPA trials, when performed according to best practices, is a useful means of conveying details about patient response to therapy not fully delineated by summary statistics, and confirms a valuable treatment benefit of under 3 hour fibrinolytic therapy in acute stroke.
Figures


Similar articles
-
Review, historical context, and clarifications of the NINDS rt-PA stroke trials exclusion criteria: Part 1: rapidly improving stroke symptoms.Stroke. 2013 Sep;44(9):2500-5. doi: 10.1161/STROKEAHA.113.000878. Epub 2013 Jul 11. Stroke. 2013. PMID: 23847249 Free PMC article. Review.
-
Defining clinically relevant cerebral hemorrhage after thrombolytic therapy for stroke: analysis of the National Institute of Neurological Disorders and Stroke tissue-type plasminogen activator trials.Stroke. 2014 Sep;45(9):2728-33. doi: 10.1161/STROKEAHA.114.005135. Epub 2014 Aug 5. Stroke. 2014. PMID: 25096731 Free PMC article.
-
The totaled health risks in vascular events (THRIVE) score predicts ischemic stroke outcomes independent of thrombolytic therapy in the NINDS tPA trial.J Stroke Cerebrovasc Dis. 2013 Oct;22(7):1111-6. doi: 10.1016/j.jstrokecerebrovasdis.2012.08.017. Epub 2012 Nov 2. J Stroke Cerebrovasc Dis. 2013. PMID: 23122722
-
Confirmation of tPA treatment effect by baseline severity-adjusted end point reanalysis of the NINDS-tPA stroke trials.Stroke. 2007 Feb;38(2):414-6. doi: 10.1161/01.STR.0000254580.39297.3c. Epub 2007 Jan 18. Stroke. 2007. PMID: 17234987
-
Role of tissue plasminogen activator in acute ischemic stroke.Ann Pharmacother. 2011 Mar;45(3):364-71. doi: 10.1345/aph.1P525. Epub 2011 Mar 8. Ann Pharmacother. 2011. PMID: 21386027 Review.
Cited by
-
Cost-Effectiveness of Solitaire Stent Retriever Thrombectomy for Acute Ischemic Stroke: Results From the SWIFT-PRIME Trial (Solitaire With the Intention for Thrombectomy as Primary Endovascular Treatment for Acute Ischemic Stroke).Stroke. 2017 Feb;48(2):379-387. doi: 10.1161/STROKEAHA.116.014735. Epub 2016 Dec 27. Stroke. 2017. PMID: 28028150 Free PMC article. Clinical Trial.
-
Risk prediction model for poor prognosis after intravenous thrombolysis among ischemic stroke patients aged ≥ 80 years and analysis of follow-up.Sci Rep. 2025 Jan 8;15(1):1354. doi: 10.1038/s41598-024-84912-0. Sci Rep. 2025. PMID: 39779810 Free PMC article.
-
A simple, assumption-free, and clinically interpretable approach for analysis of modified Rankin outcomes.Stroke. 2012 Mar;43(3):664-9. doi: 10.1161/STROKEAHA.111.632935. Epub 2012 Feb 16. Stroke. 2012. PMID: 22343650 Free PMC article.
-
Relationship between neurologic deficit severity and final functional outcome shifts and strengthens during first hours after onset.Stroke. 2012 Jun;43(6):1537-41. doi: 10.1161/STROKEAHA.111.636928. Epub 2012 Apr 5. Stroke. 2012. PMID: 22492517 Free PMC article. Clinical Trial.
-
Refined Sphenopalatine Ganglion Stimulator Placement and Intensity Setting to Augment Blood Flow and Neurologic Function.Stroke. 2019 Dec;50(12):3512-3518. doi: 10.1161/STROKEAHA.119.027177. Epub 2019 Nov 19. Stroke. 2019. PMID: 31739771 Free PMC article.
References
-
- Tufte E. The Visual Display of Quantitative Information. 2nd ed. Graphics Press LLC; Cheshire, Connecticut: 2001.
-
- Hoffman JR, Schriger DL. A graphic reanalysis of the NINDS Trial [sic] Ann Emerg Med. 2009;54:329–336. 336, e321–335. - PubMed
-
- NINDS rt-PA Stroke Group Tissue plasminogen activator for acute ischemic stroke. New England Journal of Medicine. 1995;333:1581–1587. - PubMed
-
- Ingall TJ, O'Fallon WM, Asplund K, Goldfrank LR, Hertzberg VS, Louis TA, Christianson TJ. Findings from the reanalysis of the NINDS tissue plasminogen activator for acute ischemic stroke treatment trial. Stroke. 2004;35:2418–2424. - PubMed
-
- Adams HP, Jr., del Zoppo G, Alberts MJ, Bhatt DL, Brass L, Furlan A, Grubb RL, Higashida RT, Jauch EC, Kidwell C, Lyden PD, Morgenstern LB, Qureshi AI, Rosenwasser RH, Scott PA, Wijdicks EF. Guidelines for the early management of adults with ischemic stroke: a guideline from the American Heart Association/American Stroke Association Stroke Council, Clinical Cardiology Council, Cardiovascular Radiology and Intervention Council, and the Atherosclerotic Peripheral Vascular Disease and Quality of Care Outcomes in Research Interdisciplinary Working Groups: the American Academy of Neurology affirms the value of this guideline as an educational tool for neurologists. Stroke. 2007;38:1655–1711. - PubMed
Publication types
MeSH terms
Substances
Grants and funding
LinkOut - more resources
Full Text Sources
Medical

