

Evaluation of renal hypoxia in diabetic mice by BOLD MRI
- PMID: 20829708
- PMCID: PMC4470562
- DOI: 10.1097/RLI.0b013e3181ec9b02
Evaluation of renal hypoxia in diabetic mice by BOLD MRI
Abstract
Objective: Renal hypoxia has been proposed to be a pathophysiologic feature of diabetic kidney disease but it has been difficult to demonstrate in vivo, particularly in mouse models of diabetes. The objective of this work was to examine the sensitivity of blood oxygen level-dependent (BOLD) magnetic resonance imaging (MRI) to assess renal oxygenation in vivo in a mouse model of diabetic kidney disease, the db/db mice.
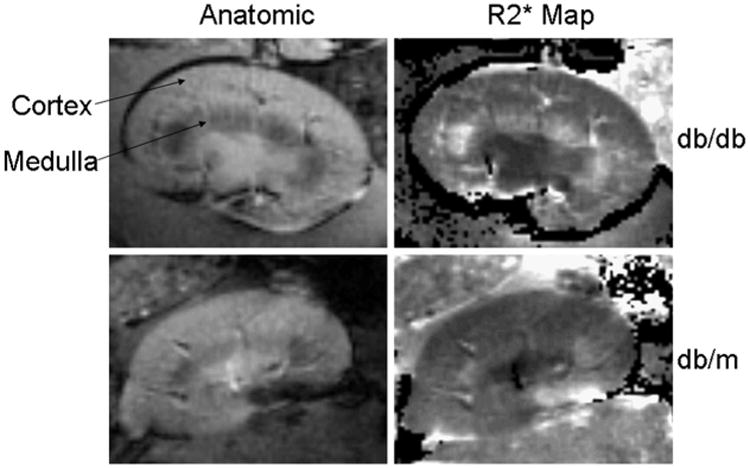
Research design and methods: Kidney BOLD MRI studies were performed on a 3.0 T scanner using multiple gradient echo sequence with a custom-designed surface coil to acquire T2*-weighted images. Studies were performed in 10-week-old db/db mice (n = 7) and db/m controls (n = 6).
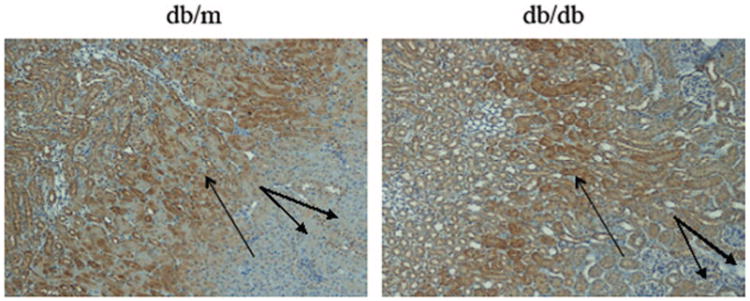
Results: R2* is a measure of the tissue deoxyhemoglobin concentration and higher values of R2* are associated with hypoxia. The db/db mice had higher medullary (43.1 ± 5.1 s⁻¹ vs. 32.3 ± 3.7⁻¹ s, P = 0.001) and cortical R2* (31.7 ± 3.1 s⁻¹ vs. 27.1 ± 4.1 s⁻¹, P = 0.04) values. Using pimonidazole staining as a marker of kidney hypoxia, in kidney sections from 10-week-old db/db mice neither cortex nor medulla had significant differences as compared with 10-week-old db/m mice (cortex: db/db 2.14 ± 0.05 vs. db/m 2.02 ± 0.28, medulla: db/db 2.81 ± 0.08 vs. db/m 2.6 ± 0.08). The db/db mice demonstrated further increased cortical and medullary hypoxia when scanned again at 15 weeks of age.
Conclusions: The report shows that renal BOLD MRI is a sensitive method for the in vivo evaluation of renal hypoxia in a mouse model of diabetic kidney disease where progressive renal hypoxia can be documented over time. BOLD MRI may be useful to monitor therapeutic interventions that may improve tissue hypoxia in the diabetic kidney.
Figures

Similar articles
-
Renal lipids and oxygenation in diabetic mice: noninvasive quantification with MR imaging.Radiology. 2013 Dec;269(3):748-57. doi: 10.1148/radiol.13122860. Epub 2013 Oct 28. Radiology. 2013. PMID: 23901127
-
Noninvasive Evaluation of Renal Hypoxia by Multiparametric Functional MRI in Early Diabetic Kidney Disease.J Magn Reson Imaging. 2022 Feb;55(2):518-527. doi: 10.1002/jmri.27814. Epub 2021 Jun 28. J Magn Reson Imaging. 2022. PMID: 34184356
-
Effect of nitric oxide synthase inhibition on intrarenal oxygenation as evaluated by blood oxygenation level-dependent magnetic resonance imaging.Invest Radiol. 2009 Feb;44(2):67-73. doi: 10.1097/RLI.0b013e3181900975. Invest Radiol. 2009. PMID: 19034027 Free PMC article.
-
Methods of Blood Oxygen Level-Dependent Magnetic Resonance Imaging Analysis for Evaluating Renal Oxygenation.Kidney Blood Press Res. 2018;43(2):378-388. doi: 10.1159/000488072. Epub 2018 Mar 8. Kidney Blood Press Res. 2018. PMID: 29539614 Review.
-
Blood oxygen level-dependent (BOLD) MRI in renovascular hypertension.Curr Hypertens Rep. 2011 Oct;13(5):370-7. doi: 10.1007/s11906-011-0218-7. Curr Hypertens Rep. 2011. PMID: 21833688 Free PMC article. Review.
Cited by
-
Knockout of TRPV1 Exacerbates Ischemia-reperfusion-induced Renal Inflammation and Injury in Obese Mice.In Vivo. 2020 Sep-Oct;34(5):2259-2268. doi: 10.21873/invivo.12036. In Vivo. 2020. PMID: 32871748 Free PMC article.
-
Compartmental analysis of renal BOLD MRI data: introduction and validation.Invest Radiol. 2012 Mar;47(3):175-82. doi: 10.1097/RLI.0b013e318234e75b. Invest Radiol. 2012. PMID: 22183077 Free PMC article.
-
Noncontrast functional MRI of the kidneys.Curr Urol Rep. 2012 Feb;13(1):99-107. doi: 10.1007/s11934-011-0229-6. Curr Urol Rep. 2012. PMID: 22102220 Review.
-
Assessment of unilateral ureter obstruction with multi-parametric MRI.Magn Reson Med. 2018 Apr;79(4):2216-2227. doi: 10.1002/mrm.26849. Epub 2017 Jul 24. Magn Reson Med. 2018. PMID: 28736875 Free PMC article.
-
Quantitative photoacoustic imaging study of tumours in vivo: Baseline variations in quantitative measurements.Photoacoustics. 2018 Dec 7;13:53-65. doi: 10.1016/j.pacs.2018.12.002. eCollection 2019 Mar. Photoacoustics. 2018. PMID: 30581729 Free PMC article.
References
-
- Rincon-Choles H, Thameem F, Lehman DM, et al. Genetic basis of diabetic nephropathy. Am J Ther. 2005;12:555–561. - PubMed
-
- Susztak K, Bottinger EP. Diabetic nephropathy: a frontier for personalized medicine. J Am Soc Nephrol. 2006;17:361–367. - PubMed
-
- Batlle D. Clinical and cellular markers of diabetic nephropathy. Kidney Int. 2003;63:2319–2330. - PubMed
-
- Leon CA, Raij L. Interaction of haemodynamic and metabolic pathways in the genesis of diabetic nephropathy. J Hypertens. 2005;23:1931–1937. - PubMed
-
- Breyer MD, Tchekneva E, Qi Z, et al. Examining diabetic nephropathy through the lens of mouse genetics. Curr Diab Rep. 2007;7:459–466. - PubMed
Publication types
MeSH terms
Substances
Grants and funding
LinkOut - more resources
Full Text Sources
Medical
Miscellaneous
