Review
. 2010 Sep 9;467(7312):167-73.
doi: 10.1038/nature09326.

Functional roles for noise in genetic circuits

Affiliations
Review

Functional roles for noise in genetic circuits

Avigdor Eldar et al. Nature. .

Abstract

The genetic circuits that regulate cellular functions are subject to stochastic fluctuations, or 'noise', in the levels of their components. Noise, far from just a nuisance, has begun to be appreciated for its essential role in key cellular activities. Noise functions in both microbial and eukaryotic cells, in multicellular development, and in evolution. It enables coordination of gene expression across large regulons, as well as probabilistic differentiation strategies that function across cell populations. At the longest timescales, noise may facilitate evolutionary transitions. Here we review examples and emerging principles that connect noise, the architecture of the gene circuits in which it is present, and the biological functions it enables. We further indicate some of the important challenges and opportunities going forward.


Figures
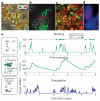
Figure 1
Figure 1. Gene expression noise is ubiquitous, and affects diverse systems at several levels
a, E. coli expressing two identical promoters driving two different fluorescent proteins, in red and green, respectively. Because of noise, the ratio of red to green intensity differs from cell to cell. b, A clonal population of B. subtilis cells differentiate into different fates in the same conditions. Here, some cells grow vegetatively or sporulate (green fluorescence), others have completed sporulation (white), and one has differentiated into a state of genetic competence (red fluorescence). Image provided by G. Süel. c, Mouse embryonic stem cells show relatively homogeneous expression of Oct4 (red nuclear protein staining), but heterogeneous expression of Nanog (green nuclear protein staining). Image provided by F. Tan. d, The C. elegans skn-1 mutant shows noise-driven partial penetrance. Two genetically identical embryos are shown. One has developed a gut (elt-2 RNA staining, red) whereas the other has not (nuclei in blue). Image provided by A. Raj. e, Mechanisms that shape noise in gene expression. Noise is characterized by bursty expression of mRNA (top). Proteins typically have longer lifetimes than bursts, leading them to time-average or `buffer' these bursts (middle). Finally, noise in one gene can propagate to generate further noise in the expression of downstream genes (bottom).
Figure 2
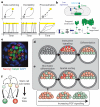
Figure 2. Frequency modulation of stochastic nuclear localization bursts enables coordination of gene regulation
a, In yeast, calcium activates calcineurin, which in turn dephosphorylates the phosphorylated form of Crz1 (Crz1P) transcription factor, causing its localization to the nucleus where it activates over 100 target genes (two are indicated schematically). b, Response curves showing expression of the two hypothetical target genes as a function of nuclear Crz1 level. As shown here, target promoters may vary in the effective affinity and sharpness of response to Crz1. c, d, Regulation of the two target genes in amplitude-modulation and frequency-modulation schemes. c, In amplitude-modulation regulation, low levels of calcium lead to more expression of B than A, whereas the reverse is true at high levels (green and blue dots indicate newly produced proteins of genes A and B, note the step in calcium, above (red)). The resulting gene expression profiles (normalized to their own maxima) therefore differ between genes. d, In a frequency-modulation model, each burst yields (on average) the same number of proteins from each gene (blue and green dots). Increased calcium levels increase the frequency of bursts and thus the total level of expression of both A and B without affecting their ratio. Gene expression therefore follows the frequency response, regardless of the differences between promoters, enforcing coordination.
Figure 3
Figure 3. Probabilistic differentiation
a, Schematic illustrations of three distinct modes of probabilistic differentiation (top) and corresponding time traces (below), as indicated. b, Noise in the lac system. Top, schematic view of the lac-positive feedback loop: increased expression of the LacY transporter (green cylinder) increases intracellular inducer levels (light blue circle), inhibiting the LacI repressor (dark blue) and further increasing expression. Bottom, lacY expression is blocked upon simultaneous binding of LacI to two operator sites on the lac promoter, which forms a DNA loop. Unbinding from one of these sites leads to transcription of at most one mRNA before re-looping, causing small increases in LacY. More rarely, LacI will be completely released from both sites, resulting in a large burst of mRNA and proteins that may lead to a switch of the positive feedback loop. cf, Probabilistic differentiation in embryonic stem cells. c, Expression of Nanog (red) and Gata6 (green) in individual cells in the inner cell mass of a mouse embryo. Note the predominantly exclusive but spatially disorganized expression of the two genes. DAPI, 4',6-diamidino-2-phenylindole. Image adapted with permission from ref. 59. d, e, Two models for patterning of the inner cell mass (ICM). d, In a positional model cell, fate is determined by position through signalling from neighbouring cells. e, In the stochastic sorting model, cells first differentiate randomly, and subsequently move to appropriate positions based on their identity. f, Stem cell populations are not homogeneous but rather consist of a dynamic distribution of sub-states (dim green and red circles). Some sub-states resemble the differentiated states to which they are more prone to differentiate (bright green and red circles).
Figure 4
Figure 4. Roles of noise in evolution
a–c, How genetically controlled noise in a quantitative trait could respond to directional selection. a, Directional selection for values of the trait above a threshold (black line and arrow) can lead to reduced noise when the threshold is low. Thus, the noisier distribution (blue line) has less area above the threshold (cross-hatch) than a less noisy distribution (green line, grey shading) with the same mean. b, By contrast, when selection is tighter, the noisier distribution is favoured, as shown by the larger above-threshold area under the blue distribution compared to the green distribution. c, Over evolutionary timescales, noise (σ, defined as the standard variation of the distribution) would thus be expected to increase under tight selection and decrease under weak selection. In both cases, selection would also increase the mean value of the trait (not shown). d–f, Noise enables the generation of partially penetrant alternative cell fates, which facilitate discrete evolutionary changes. d, Wild-type B. subtilis cells (top) contain two chromosomes (yellow circles) when they initiate sporulation by an asymmetric division (red line). This event leads to differentiation of the forespore (smaller compartment) followed by the mother cell (larger compartment), and eventually results in formation of a single spore (white circle). Mutations can increase the frequency with which cells acquire an extra chromosome (yellow lightning) and/or an extra compartment (red lightning). Cells with both characteristics form two mature spores from a single sporulating cell (twins). e, Depending on the number of chromosomes and compartments, single cells show four distinct fates, each of which has a specific fitness (the corners of the square), assumed to be proportional to the expected number of spores it will produce. Evolution from mono-spores to twins would be difficult with a single mutation (curved arrow) as it would have to affect both septation and replication. However, several mutations affecting the penetrance of extra chromosomes and extra compartments can allow a gradual increase in the mean fitness of the population (path with multiple arrows). WT, wild type. f, This allows a gradual evolutionary transition from a homogenous population of mono-spores, to a partially penetrant intermediate population of multiple fates, to a homogenous population of twin spores.

References

    1. Maheshri N, O'Shea EK. Living with noisy genes: how cells function reliably with inherent variability in gene expression. Annu. Rev. Biophys. Biomol. Struct. 2007;36:413–434. - PubMed
    1. Raj A, van Oudenaarden A. Nature, nurture, or chance: stochastic gene expression and its consequences. Cell. 2008;135:216–226. - PMC - PubMed
    1. Locke J, Elowitz M. Using movies to analyse gene circuit dynamics in single cells. Nature Rev. Microbiol. 2009;7:383–392. - PMC - PubMed
    1. Davidson C, Surette M. Individuality in bacteria. Annu. Rev. Genet. 2008;42:253–268. - PubMed
    1. Losick R, Desplan C. Stochasticity and cell fate. Science. 2008;320:65–68. - PMC - PubMed

Publication types