Inhibition of inducible nitric oxide synthase reverses the loss of functional hyperemia in diabetic retinopathy
- PMID: 20830810
- PMCID: PMC3206643
- DOI: 10.1002/glia.21068
Inhibition of inducible nitric oxide synthase reverses the loss of functional hyperemia in diabetic retinopathy
Abstract
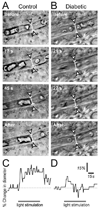
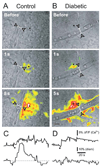
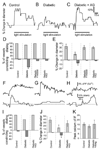
Neuronal activity leads to arteriole dilation and increased blood flow in retinal vessels. This response, termed functional hyperemia, is diminished in the retinas of diabetic patients, possibly contributing to the development of diabetic retinopathy. The mechanism responsible for this loss is unknown. Here we show that light-evoked arteriole dilation was reduced by 58% in a streptozotocin-induced rat model of type 1 diabetes. Functional hyperemia is believed to be mediated by glial cells and we found that glial-evoked vasodilation was reduced by 60% in diabetic animals. The diabetic retinas showed neither a decrease in the thickness of the retinal layers nor an increase in neuronal loss, although signs of early glial reactivity and an upregulation of inducible nitric oxide synthase (iNOS) were detected. Inhibition of iNOS restored both light- and glial-evoked dilations to control levels. These findings suggest that high NO levels resulting from iNOS upregulation alters glial control of vessel diameter and may underlie the loss of functional hyperemia observed in diabetic retinopathy. Restoring functional hyperemia by iNOS inhibition may limit the progression of retinopathy in diabetic patients.
Figures


Similar articles
-
Aminoguanidine reverses the loss of functional hyperemia in a rat model of diabetic retinopathy.Front Neuroenergetics. 2012 Jan 10;3:10. doi: 10.3389/fnene.2011.00010. eCollection 2011. Front Neuroenergetics. 2012. PMID: 22291637 Free PMC article.
-
Curcumin Attenuates Retinal Vascular Leakage by Inhibiting Calcium/Calmodulin-Dependent Protein Kinase II Activity in Streptozotocin-Induced Diabetes.Cell Physiol Biochem. 2016;39(3):1196-208. doi: 10.1159/000447826. Epub 2016 Sep 5. Cell Physiol Biochem. 2016. PMID: 27595397
-
Upregulated endothelin system in diabetic vascular dysfunction and early retinopathy is reversed by CPU0213 and total triterpene acids from Fructus Corni.Clin Exp Pharmacol Physiol. 2007 Dec;34(12):1228-33. doi: 10.1111/j.1440-1681.2007.04698.x. Clin Exp Pharmacol Physiol. 2007. PMID: 17973859
-
Functional hyperemia and mechanisms of neurovascular coupling in the retinal vasculature.J Cereb Blood Flow Metab. 2013 Nov;33(11):1685-95. doi: 10.1038/jcbfm.2013.145. Epub 2013 Aug 21. J Cereb Blood Flow Metab. 2013. PMID: 23963372 Free PMC article. Review.
-
Regulation of blood flow in diabetic retinopathy.Vis Neurosci. 2020 Jul 20;37:E004. doi: 10.1017/S0952523820000036. Vis Neurosci. 2020. PMID: 32684188 Review.
Cited by
-
Diabetic retinopathy: loss of neuroretinal adaptation to the diabetic metabolic environment.Ann N Y Acad Sci. 2014 Apr;1311:174-90. doi: 10.1111/nyas.12412. Epub 2014 Mar 27. Ann N Y Acad Sci. 2014. PMID: 24673341 Free PMC article. Review.
-
Purinergic neuron-glia interactions in sensory systems.Pflugers Arch. 2014 Oct;466(10):1859-72. doi: 10.1007/s00424-014-1510-6. Epub 2014 Apr 6. Pflugers Arch. 2014. PMID: 24705940 Review.
-
Disruption of astrocyte-vascular coupling and the blood-brain barrier by invading glioma cells.Nat Commun. 2014 Jun 19;5:4196. doi: 10.1038/ncomms5196. Nat Commun. 2014. PMID: 24943270 Free PMC article.
-
IGF-1 signaling via the PI3K/Akt pathway confers neuroprotection in human retinal pigment epithelial cells exposed to sodium nitroprusside insult.J Mol Neurosci. 2015 Apr;55(4):931-40. doi: 10.1007/s12031-014-0448-7. Epub 2014 Oct 23. J Mol Neurosci. 2015. PMID: 25339505
-
Effect of increased oxygen tension on flicker-induced vasodilatation in the human retina.J Cereb Blood Flow Metab. 2014 Dec;34(12):1914-8. doi: 10.1038/jcbfm.2014.161. Epub 2014 Sep 24. J Cereb Blood Flow Metab. 2014. PMID: 25248833 Free PMC article.
References
-
- Alder VA, Su EN, Yu DY, Cringle SJ, Yu PK. Diabetic retinopathy: Early functional changes. Clin Exp Pharmacol Physiol. 1997;24:785–788. - PubMed
-
- Amruthesh SC, Falck JR, Ellis EF. Brain synthesis and cerebrovascular action of epoxygenase metabolites of arachidonic acid. J Neurochem. 1992;58:503–510. - PubMed
-
- Antonetti DA, Barber AJ, Bronson SK, Freeman WM, Gardner TW, Jefferson LS, Kester M, Kimball SR, Krady JK, LaNoue KF, Norbury CC, Quinn PG, Sandirasegarane L, Simpson IA. Diabetic retinopathy: seeing beyond glucose-induced microvascular disease. Diabetes. 2006;55:2401–2411. - PubMed
Publication types
MeSH terms
Substances
Grants and funding
LinkOut - more resources
Full Text Sources
Medical

