The membrane protein of severe acute respiratory syndrome coronavirus acts as a dominant immunogen revealed by a clustering region of novel functionally and structurally defined cytotoxic T-lymphocyte epitopes
- PMID: 20831383
- PMCID: PMC7537489
- DOI: 10.1086/656315
The membrane protein of severe acute respiratory syndrome coronavirus acts as a dominant immunogen revealed by a clustering region of novel functionally and structurally defined cytotoxic T-lymphocyte epitopes
Erratum in
- J Infect Dis. 2011 Jun 1;203(11):1699
Abstract
Background: Severe acute respiratory syndrome coronavirus (SARS-CoV), which emerged with highly contagious and life-threatening characteristics in 2002, remains a potential risk for future outbreaks. Membrane (M) and envelope (E) proteins are major structural proteins of the SARS-CoV. The M protein has been determined as a protective antigen in humoral responses. However, its potential roles in stimulating cellular immunity remain elusive.
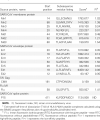
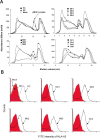
Methods: In this study, a panel of peptides derived from M and E proteins were tested by in vitro refolding, T2 cell-binding assays, and responses stimulated by cytotoxic T-lymphocyte (CTL) epitopes in HLA-A2.1/K(b) transgenic mice and human peripheral blood mononuclear cells (PBMCs).
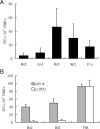
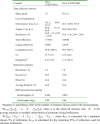
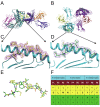
Results: A nonameric epitope Mn2 and a decameric epitope Md3 derived from the M protein were identified and used for the evaluation of M protein-specific immunity. Responses stimulated by M protein-specific CTL epitopes have been found in the PBMCs of donors who had recovered from SARS infection. Additionally, the transmembrane domain of the M protein may contain a T cell epitope cluster revealed by the immunogenic and structural analysis of a panel of truncated peptides overlapping with Mn2 and Md3.
Conclusions: The M protein of SARS-CoV holds dominant cellular immunogenicity. This, together with previous reports of a strong humoral response against the M protein, may help to further explain the immunogenicity of SARS and serves as potential targets for SARS-CoV vaccine design.
Figures



Similar articles
-
HLA-A*0201 T-cell epitopes in severe acute respiratory syndrome (SARS) coronavirus nucleocapsid and spike proteins.Biochem Biophys Res Commun. 2006 May 26;344(1):63-71. doi: 10.1016/j.bbrc.2006.03.152. Biochem Biophys Res Commun. 2006. PMID: 16630549 Free PMC article.
-
Screening and identification of severe acute respiratory syndrome-associated coronavirus-specific CTL epitopes.J Immunol. 2006 Aug 15;177(4):2138-45. doi: 10.4049/jimmunol.177.4.2138. J Immunol. 2006. PMID: 16887973
-
Induction of T-cell response by a DNA vaccine encoding a novel HLA-A*0201 severe acute respiratory syndrome coronavirus epitope.Vaccine. 2007 Aug 10;25(32):6070-7. doi: 10.1016/j.vaccine.2007.05.025. Epub 2007 Jun 4. Vaccine. 2007. PMID: 17629360 Free PMC article.
-
T-cell immunity of SARS-CoV: Implications for vaccine development against MERS-CoV.Antiviral Res. 2017 Jan;137:82-92. doi: 10.1016/j.antiviral.2016.11.006. Epub 2016 Nov 11. Antiviral Res. 2017. PMID: 27840203 Free PMC article. Review.
-
Immunological responses against SARS-coronavirus infection in humans.Cell Mol Immunol. 2004 Apr;1(2):119-22. Cell Mol Immunol. 2004. PMID: 16212898 Review.
Cited by
-
Progress and Prospects on Vaccine Development against SARS-CoV-2.Vaccines (Basel). 2020 Mar 29;8(2):153. doi: 10.3390/vaccines8020153. Vaccines (Basel). 2020. PMID: 32235387 Free PMC article. Review.
-
The clinical and immunological characteristics of COVID-19 patients with delayed SARS-CoV-2 virus clearance.Immun Inflamm Dis. 2023 Sep;11(9):e999. doi: 10.1002/iid3.999. Immun Inflamm Dis. 2023. PMID: 37773701 Free PMC article.
-
Enhanced protection in mice induced by immunization with inactivated whole viruses compare to spike protein of middle east respiratory syndrome coronavirus.Emerg Microbes Infect. 2018 Apr 4;7(1):60. doi: 10.1038/s41426-018-0056-7. Emerg Microbes Infect. 2018. PMID: 29618723 Free PMC article.
-
The T-cell-directed vaccine BNT162b4 encoding conserved non-spike antigens protects animals from severe SARS-CoV-2 infection.Cell. 2023 May 25;186(11):2392-2409.e21. doi: 10.1016/j.cell.2023.04.007. Epub 2023 Apr 13. Cell. 2023. PMID: 37164012 Free PMC article.
-
Genomic characterization of SARS-CoV-2 in Egypt.J Adv Res. 2021 May;30:123-132. doi: 10.1016/j.jare.2020.11.012. Epub 2020 Nov 26. J Adv Res. 2021. PMID: 33262895 Free PMC article.
References
-
- Ksiazek TG, Erdman D, Goldsmith CS, et al. A novel coronavirus associated with severe acute respiratory syndrome. N Engl J Med. 2003;348:1953–1966. - PubMed
-
- Rota PA, Oberste MS, Monroe SS, et al. Characterization of a novel coronavirus associated with severe acute respiratory syndrome. Science. 2003;300:1394–1399. - PubMed
MeSH terms
Substances
LinkOut - more resources
Full Text Sources
Other Literature Sources
Molecular Biology Databases
Research Materials
Miscellaneous

