. 2010 Sep 10:10:274.
doi: 10.1186/1471-2148-10-274.

Extensive loss of translational genes in the structurally dynamic mitochondrial genome of the angiosperm Silene latifolia

Affiliations

Extensive loss of translational genes in the structurally dynamic mitochondrial genome of the angiosperm Silene latifolia

Daniel B Sloan et al. BMC Evol Biol. .

Abstract

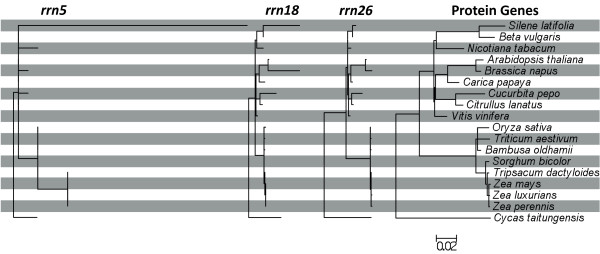
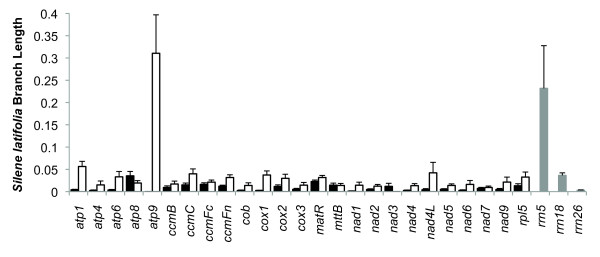
Background: Mitochondrial gene loss and functional transfer to the nucleus is an ongoing process in many lineages of plants, resulting in substantial variation across species in mitochondrial gene content. The Caryophyllaceae represents one lineage that has experienced a particularly high rate of mitochondrial gene loss relative to other angiosperms.

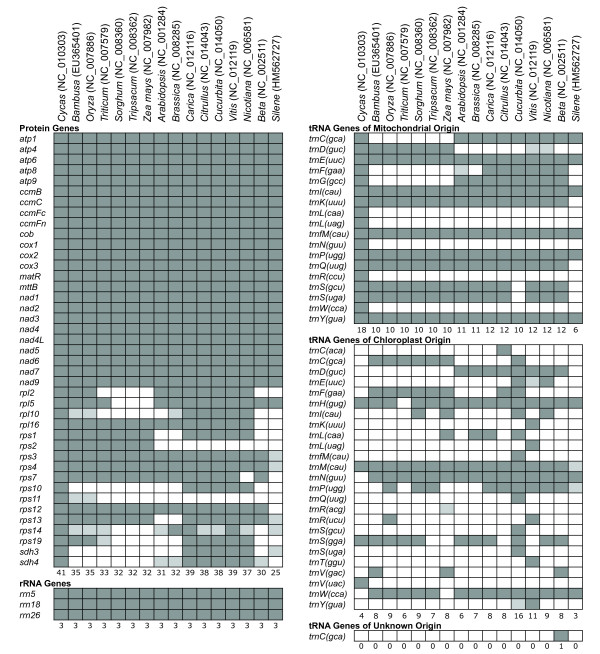
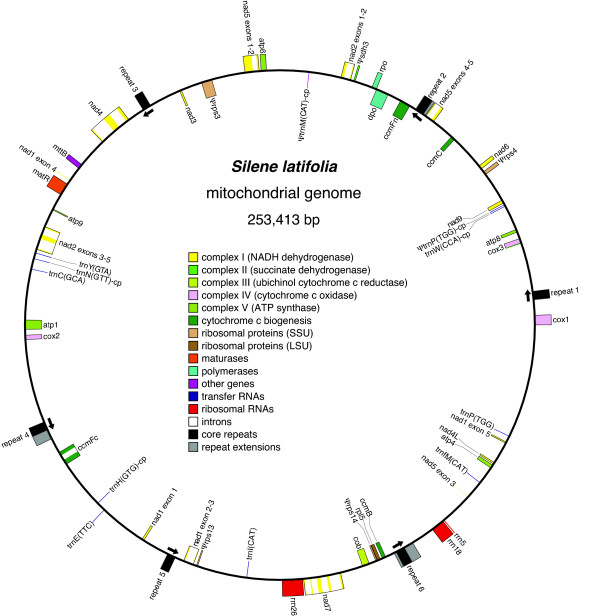
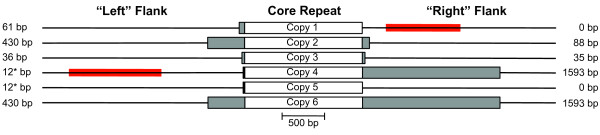
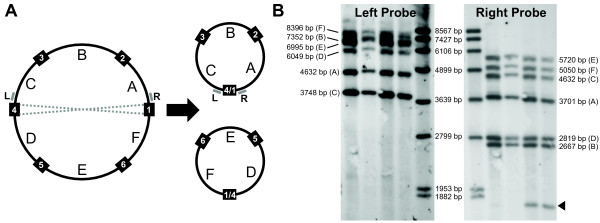
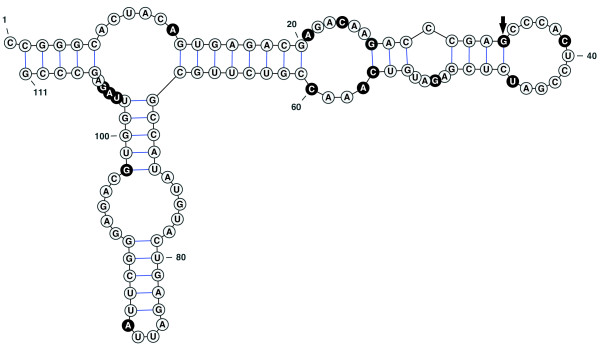
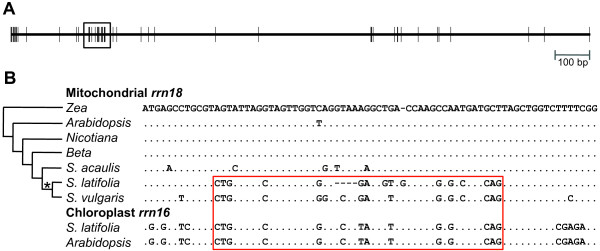
Results: In this study, we report the first complete mitochondrial genome sequence from a member of this family, Silene latifolia. The genome can be mapped as a 253,413 bp circle, but its structure is complicated by a large repeated region that is present in 6 copies. Active recombination among these copies produces a suite of alternative genome configurations that appear to be at or near "recombinational equilibrium". The genome contains the fewest genes of any angiosperm mitochondrial genome sequenced to date, with intact copies of only 25 of the 41 protein genes inferred to be present in the common ancestor of angiosperms. As observed more broadly in angiosperms, ribosomal proteins have been especially prone to gene loss in the S. latifolia lineage. The genome has also experienced a major reduction in tRNA gene content, including loss of functional tRNAs of both native and chloroplast origin. Even assuming expanded wobble-pairing rules, the mitochondrial genome can support translation of only 17 of the 61 sense codons, which code for only 9 of the 20 amino acids. In addition, genes encoding 18S and, especially, 5S rRNA exhibit exceptional sequence divergence relative to other plants. Divergence in one region of 18S rRNA appears to be the result of a gene conversion event, in which recombination with a homologous gene of chloroplast origin led to the complete replacement of a helix in this ribosomal RNA.

Conclusions: These findings suggest a markedly expanded role for nuclear gene products in the translation of mitochondrial genes in S. latifolia and raise the possibility of altered selective constraints operating on the mitochondrial translational apparatus in this lineage.


Figures

Figure 1
Figure 1
Gene content in seed plant mitochondrial genomes. Dark gray boxes indicate the presence of an intact reading frame or folding structure and, therefore, a putatively functional gene, while light gray boxes indicate the presence of a putative pseudogene. The numbers at the bottom of each gene group indicate the total number of intact genes for that species. Note that in some cases the presence of an intact gene sequence may not actually reflect functionality. In particular, for tRNA genes of chloroplast origin, it is possible that transferred sequences still appear intact, but nevertheless, are not functionally expressed in the mitochondrion [37,90]. GenBank accession numbers for each genome are indicated in parentheses.
Figure 2
Figure 2
Mitochondrial genome map. One of many possible master circle representations of the Silene latifolia mitochondrial genome (although this does not necessarily reflect the in vivo structure of the genome; see Discussion). Boxes inside and outside the circle correspond to genes on the clockwise and anti-clockwise strand, respectively. Arrows indicate the orientation of repeats as shown in Figure 3. This figure was generated with OGDraw v1.1 [91].
Figure 3
Figure 3
Structure of large repeated sequences in the Silene latifolia mitochondrial genome. The genome contains a 1362 bp direct repeat present in 6 copies (white boxes). Additional repeat extensions (gray boxes) of varying length are shared by some but not all of the regions that flank the repeat. Shorter repeat extensions are identical in sequence to the initial portions of longer repeat extensions, with the exception of the "left" flanking regions next to repeat copies 4 and 5, which share a short 12 bp sequence (solid black boxes) that is unique relative to the other flanking sequences. Single copy sequences flanking the repeats are shown by thin black lines. The red bars indicate the location of probes used in Southern blot hybridizations (Figure 4). The values on the left and right side indicate the length of the respective repeat extensions. The order of the repeat copies and their flanking sequences corresponds to the genome conformation shown in Figure 2.
Figure 4
Figure 4
Recombining repeats in the Silene latifolia mitochondrial genome. (A) A stylized version of the master circle undergoing one of many possible recombination events. The black boxes represent the 6-copy repeat with numbering corresponding to Figure 2. The lettered sections represent intervening single-copy regions. The "left" and "right" probes used in Southern blot hybridizations are indicated with small gray bars and labeled L and R, respectively. The dotted gray lines indicate a crossover event between repeat copies that produces 2 sub-genomic molecules. Given all possible recombination events, each left flanking sequence has the potential to be paired with 6 different right flanking sequences (and vice versa), and therefore, each probe is expected to hybridize to 6 restriction fragments. (B) Southern blot hybridizations with "left" and "right" probes each show 6 strong bands, corresponding to the sizes predicted based on recombination among the 6 large repeats (see Additional File 1 for a more resolved replicate of the "left" probe blot). The left pair of lanes contain DNA samples from one full-sib family, while the right pair contain DNA samples from a second full-sib family. The size standards are indicated by the values between the two blots. The values on either side represent the predicted fragment sizes with the corresponding single-copy flanking sequence noted in parentheses. The black triangle indicates an unexpected 1.8 kb fragment detected in some but not all individuals with the "right" probe.
Figure 5
Figure 5
Phylogenetic analysis of substitution rates in seed plant mitochondrial genomes. rRNA gene branch lengths are in terms of substitutions per site, while protein gene branch lengths reflect synonymous substitutions per site based on a concatenated dataset of 25 genes present in the mitochondrial genomes of all 18 species. All analyses used a constrained topology.
Figure 6
Figure 6
Substitution rate variation among genes in Silene latifolia. Each bar represents the terminal branch length for S. latifolia based on a phylogenetic analysis of 18 land plant species with fully sequenced mitochondrial genomes. For protein genes, branch lengths were estimated in terms of non-synonymous substitutions (black bars) or synonymous substitutions (white bars) per site. For rRNA genes, branch lengths were estimated in terms of substitutions per site (gray bars). Error bars represent standard errors, which were calculated as described by Parkinson et al. [79].
Figure 7
Figure 7
Predicted secondary structure for Silene latifolia 5S ribosomal RNA (rrn5). Sites that have experienced a substitution in the S. latifolia lineage are highlighted in black. The black arrow indicates the one predicted change in secondary structure resulting from nucleotide substitution (a novel base pairing between positions 34 and 46). The figure was generated with VARNA v3.6 [92].
Figure 8
Figure 8
Gene conversion between mitochondrial and chloroplast small subunit rRNA genes. (A) The spatial distribution of substitutions (vertical lines) in mitochondrial rrn18 that distinguish Silene latifolia from Beta vulgaris (regions that could not be reliably aligned in a multiple species alignment were excluded). The black box indicates the region shown in detail below. (B) Aligned sequences of angiosperm mitochondrial rrn18 and chloroplast rrn16. Dots in the alignment indicate sequence identity with the Zea reference sequence. The red box shows the minimal extent of the region inferred to have experienced a gene conversion event, which also corresponds to the position of helix 240 in E. coli 16S rRNA [58]. Analysis of these sequences with GENECONV v1.81a using a mismatch cost of 1 found highly significant evidence for gene conversion in this region (p < 0.0001). The asterisk indicates the inferred phylogenetic timing of that event. Gene sequences were taken from published genomes (see Figure 1) with the exception S. acaulis and S. vulgaris rrn18 (GenBank EF547249 and HM562728) and S. latifolia rrn16 (AB189069).

References

    1. Gray MW, Burger G, Lang BF. Mitochondrial evolution. Science. 1999;283(5407):1476–1481. doi: 10.1126/science.283.5407.1476. - DOI - PubMed
    1. Ward BL, Anderson RS, Bendich AJ. The mitochondrial genome is large and variable in a family of plants (Cucurbitaceae) Cell. 1981;25(3):793–803. doi: 10.1016/0092-8674(81)90187-2. - DOI - PubMed
    1. Ellis J. Promiscuous DNA--chloroplast genes inside plant mitochondria. Nature. 1982;299(5885):678–679. doi: 10.1038/299678a0. - DOI - PubMed
    1. Kubo T, Newton KJ. Angiosperm mitochondrial genomes and mutations. Mitochondrion. 2008;8(1):5–14. doi: 10.1016/j.mito.2007.10.006. - DOI - PubMed
    1. Richardson AO, Palmer JD. Horizontal gene transfer in plants. J Exp Bot. 2007;58(1):1–9. doi: 10.1093/jxb/erl148. - DOI - PubMed

Publication types

LinkOut - more resources