. 2010 Sep 28;20(18):1589-601.
doi: 10.1016/j.cub.2010.07.045. Epub 2010 Sep 9.

Sexual dimorphism in the fly brain

Affiliations

Sexual dimorphism in the fly brain

Sebastian Cachero et al. Curr Biol. .

Abstract

Background: Sex-specific behavior may originate from differences in brain structure or function. In Drosophila, the action of the male-specific isoform of fruitless in about 2000 neurons appears to be necessary and sufficient for many aspects of male courtship behavior. Initial work found limited evidence for anatomical dimorphism in these fru+ neurons. Subsequently, three discrete anatomical differences in central brain fru+ neurons have been reported, but the global organization of sex differences in wiring is unclear.

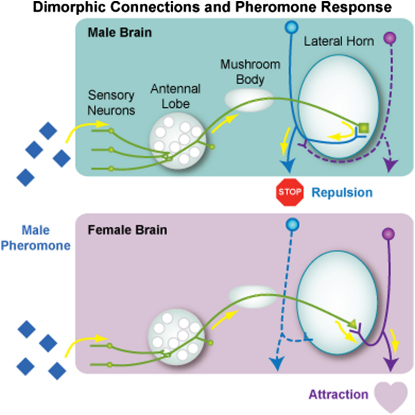
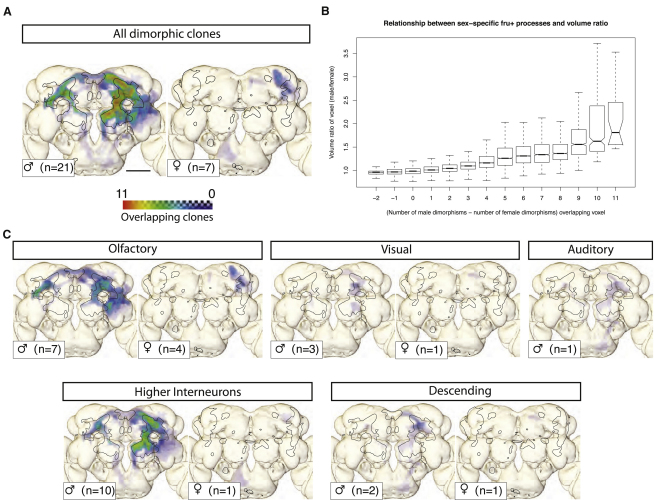
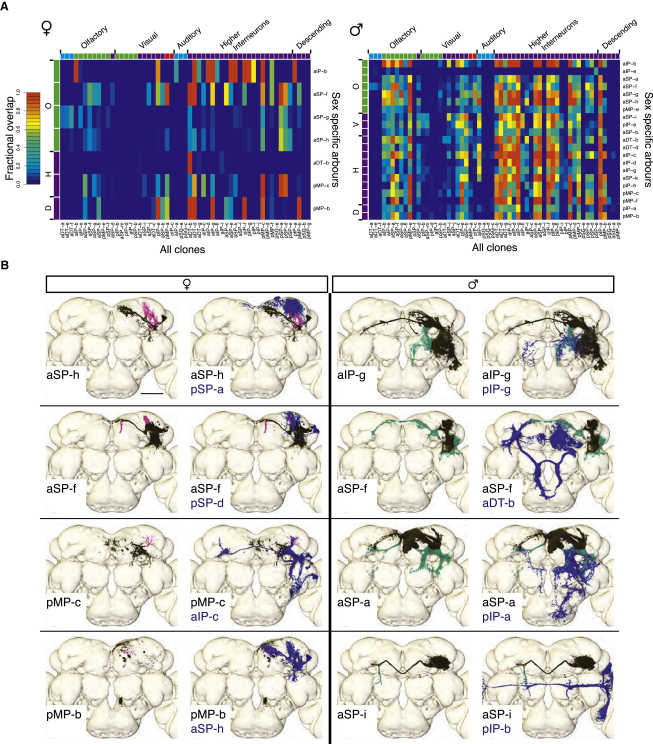
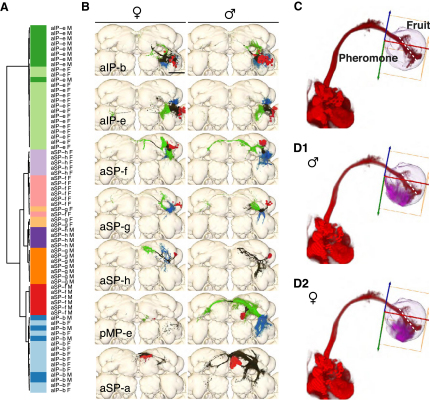
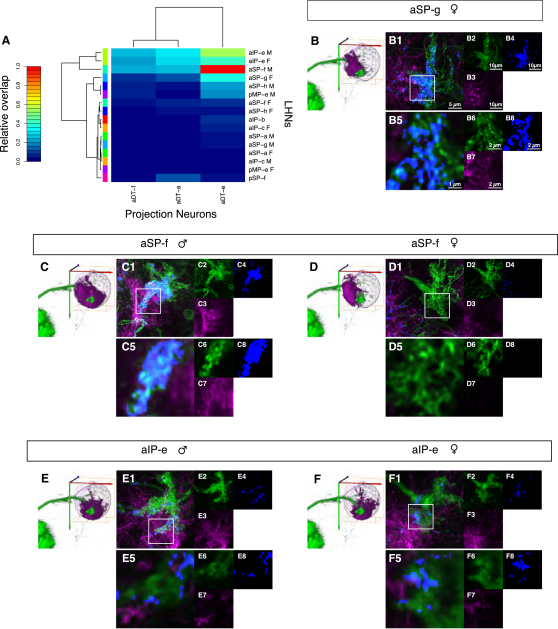
Results: A global search for structural differences in the Drosophila brain identified large volumetric differences between males and females, mostly in higher brain centers. In parallel, saturating clonal analysis of fru+ neurons using mosaic analysis with a repressible cell marker identified 62 neuroblast lineages that generate fru+ neurons in the brain. Coregistering images from male and female brains identified 19 new dimorphisms in males; these are highly concentrated in male-enlarged higher brain centers. Seven dimorphic lineages also had female-specific arbors. In addition, at least 5 of 51 fru+ lineages in the nerve cord are dimorphic. We use these data to predict >700 potential sites of dimorphic neural connectivity. These are particularly enriched in third-order olfactory neurons of the lateral horn, where we provide strong evidence for dimorphic anatomical connections by labeling partner neurons in different colors in the same brain.

Conclusion: Our analysis reveals substantial differences in wiring and gross anatomy between male and female fly brains. Reciprocal connection differences in the lateral horn offer a plausible explanation for opposing responses to sex pheromones in male and female flies.


Figures

None
Graphical abstract
Figure 1
Figure 1
Male-Enlarged Regions Are Genotype Specific and Colocalize with fruitless Expression (A) Schematic of Drosophila neuropil compartments and olfactory system. Projection neurons are cyan, mushroom body neurons are green. (B) Surface rendering of male (green)- and female (magenta)-enlarged regions on our template brain. (C) Summary of main male-enlarged regions (MERs). Green: pars intercerebralis; red: arch; mustard: ring; turquoise: lateral junction; light blue: DA1 glomerulus; yellow: tips of mushroom body gamma lobes. (D–K) Two individual slices from average template brains for control male (D and H), control female (E and I), tra mutant female (F and J), and fruM mutant female (G and K). In (D)–(G), arrow indicates male-enlarged arch; in (H)–(K), it shows the male expansion of the ring neuropil. (L) Overlap between MERs (blue) and fruGal4 expression pattern (green). (M and N) Z projections (standard deviation) of the fruGal4 driving CD8-GFP in males (M) and females (N). For clarity, cell bodies in the surface of the brain and the mushroom bodies have been removed. A false color lookup table has been applied to emphasize contrast. (O) Schematic of Drosophila sex determination hierarchy. Bold-type gene products are active, gray are inactive. (P) Quantification of the volume of the MER for control and mutant flies. The central line indicates the median, the box represents the 25% and 75% quartiles, and the whiskers extend to ±1.5 times the interquartile range. Scale bar in all panels represents 50 μm. See also Figure S1.
Figure 2
Figure 2
Dimorphisms in fru+ Neuronal Arbors Volume renderings of representative clones with sexually dimorphic projections. Nondimorphic regions are black, male-specific arbors are green, and female-specific arbors are magenta. Note that some black regions look different between the sexes in these examples, but comparison of multiple examples shows that consistent differences are restricted to green and magenta regions. Clones in the left column have dimorphic arbors in both sexes, and representative examples are shown of each of the male and female brains, whereas clones in the right two columns have only male-specific arbors. In all cases, sex-specific arbors are either missing or much weaker in the other sex. Scale bar represents 50 μm. See also Figure S2 and Movie S1.
Figure 3
Figure 3
Distribution of fru+ Dimorphisms in the Brain (A) Dimorphic projections of fru+ neurons overlap dimorphic neuropil regions. Left shows overlap between male-specific arbors of fru+ clones and MER of the neuropil; right shows overlap between female-specific arbors and the female-enlarged regions (FERs) of neuropil. Colored regions are Z projections of the dimorphic arbors shown in Figure 2. Because these images are derived from unilateral mosaic analysis with a repressible cell marker (MARCM) clones with cell bodies on the fly's left (which is on the right of this figure), they are not symmetric. The MER or FER is outlined in each panel as appropriate. Color scale: transparent (no clones) to red (11 clones). Although there are 21 dimorphic clones in males, the region of maximum density corresponds to the overlap of a subset of 11 of those clones. (B) Volumetric dimorphism and sex-specific arbors. There is a strong positive relationship between how many male (or female) specific arbors overlap any given voxel and the male:female volume ratio. For example, voxels with the highest number of overlapping dimorphic arbors (11) also have the highest volume ratio (median 81% male-enlarged). Box plot is as in Figure 1P with the addition of notches to indicate the 95% confidence interval for difference between medians. (C) Clones from (A) broken into functional groups (see Table 1). Each panel contains the dimorphic regions of all clones that belong to a given category. The number of clones in each category that have dimorphic regions and therefore contribute to each panel is shown at the bottom left (e.g., there are 16 visual clones, but only three have male dimorphic processes, and one has female dimorphic processes). Color scale is the same as in (A). Scale bar represents 50 μm.
Figure 4
Figure 4
Dimorphic fru+ Neurons Likely Form Dimorphic Connections (A) Heat maps showing overlap between dimorphic arbors (y axis) from Figure 2 and all clones (x axis). Female-specific arbors are on the left, male-specific arbors are on the right. Red indicates strong overlap, blue indicates no overlap, as per the scale bar. Where two clones have multiple regions of overlap, the strongest overlap is plotted. Clones are grouped by sensory system (see Table 1). Just above and to the left of the heat map are color-coded indicators of the proposed sensory role (i.e., blue: second-order sensory clones, green: third-order sensory clones, purple: higher-order sensory clones, red: visual centrifugal sensory clones). D denotes descending clones, H denotes higher-order clones, V denotes visual clones, and O denotes olfactory clones. (B) Sexually dimorphic clones alter potential connectivity in the fru+ circuit. Eight examples demonstrate differences in potential connectivity when a clone has a sex-specific arbor (four examples from each sex, females on the left). For each example, the left panel shows a dimorphic clone alone with nondimorphic arbors in black, female-specific arbors in magenta, and male-specific arbors in green. The right panel overlays the second clone in blue. Scale bar represents 50 μm. See also Figure S4 and Movie S2.
Figure 5
Figure 5
fru+ Lateral Horn Neurons (A) Cluster analysis of lateral horn innervation patterns of many examples of five classes of fru+ lateral horn neuron (LHN). Color bars indicate class and sex, with five hues (blue, red, orange, magenta, and green) representing male clones and matched but paler colors representing female clones. For four of these classes, clones of the same sex cocluster but clones of the same class from different sexes do not. The exception is aIP-b, in which male and female samples do not separate (light and dark blue). See Supplemental Experimental Procedures for details. (B) Volume rendering of seven classes of fru+ LHNs in males and females. Neuronal arbors are colored based on UAS:synaptotagmin staining and neuronal morphology. Cell bodies are in red, axons are in green, dendrites are in blue, unclassified neurites are in black. We did not obtain UAS:synaptotagmin data for clone aSP-a or the male aSP-h clone. (C) The bundle of aDT-a axons (red) traversing the LH serves as a simple landmark to separate pheromone and general odor zones of the lateral horn (dotted white line) [7]. (D1 and D2) Processes of all male (D1) and female (D2) fru+ LHNs (magenta) are restricted to the pheromone zone. Only LHN neurites within the LH are shown. Scale bar represents 50 μm. See also Figure S3.
Figure 6
Figure 6
Connectivity in the Olfactory System (A) Heat map representation of registration-based overlap between projection neuron (PN) axons and neurites of all fru+ LHNs. Color indicates relative overlap score (see Supplemental Experimental Procedures) ranging from 0 (no overlap) to 1 (the strongest observed overlap). (B–B8) Lateral horn from a female with LHN clone aSP-g and PN clone aDT-e, labeled in different colors in the same brain by means of twin-spot MARCM. (B1)–(B4) are Z projections (maximum intensity) of the axon terminals of pheromone-responsive PNs and their potential LHN partners. (B1) shows PNs in green and LHNs in magenta overlaid with a blue channel that indicates places where PN and LHN processes overlap or occupy neighboring pixels (see Supplemental Experimental Procedures). (B2)–(B4) are the individual channels. (B5)–(B8) are a single slice of expanded views of the white box from (B1). Note that in females there are large regions of proximity between the two clones. For orientation, a volume rendering of aDT-e (green) and the LHN clone in the LH is shown to the left of (B1). (C–C8) Twin-spot MARCM lateral horn from a male with LHN clone aSP-f and PN clone aDT-e in different colors. Colors and scale are as in (B). There are extensive regions of proximity between the PNs and the LHNs. (D–D8) Female LHN clone aSP-f and PN clone aDT-e in different colors. There are no regions of proximity around the pheromone-sensitive PN axon terminals, a marked difference from (C). (E–E8) Male LHN clone aIP-e and PN clone aDT-e in different colors. There are limited regions of proximity between the two clones on an order similar to the female in (F). (F–F8) Female LHN clone aIP-e and PN clone aDT-e in different colors. There are limited regions of proximity between the two clones on an order similar to the male in (E).

References

    1. Hall J.C. The mating of a fly. Science. 1994;264:1702–1714. - PubMed
    1. Baker B.S., Taylor B.J., Hall J.C. Are complex behaviors specified by dedicated regulatory genes? Reasoning from Drosophila. Cell. 2001;105:13–24. - PubMed
    1. Billeter J.C., Rideout E.J., Dornan A.J., Goodwin S.F. Control of male sexual behavior in Drosophila by the sex determination pathway. Curr. Biol. 2006;16:R766–R776. - PubMed
    1. Hotta Y., Benzer S. Mapping of behaviour in Drosophila mosaics. Nature. 1972;240:527–535. - PubMed
    1. Hall J.C. Control of male reproductive behavior by the central nervous system of Drosophila: Dissection of a courtship pathway by genetic mosaics. Genetics. 1979;92:437–457. - PMC - PubMed

Publication types

LinkOut - more resources