. 2010 Sep 24;33(3):375-86.
doi: 10.1016/j.immuni.2010.08.012. Epub 2010 Sep 9.

Human CD14dim monocytes patrol and sense nucleic acids and viruses via TLR7 and TLR8 receptors

Affiliations

Human CD14dim monocytes patrol and sense nucleic acids and viruses via TLR7 and TLR8 receptors

Jérôme Cros et al. Immunity. .

Abstract

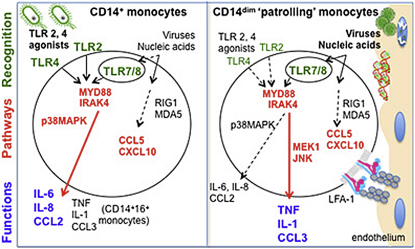
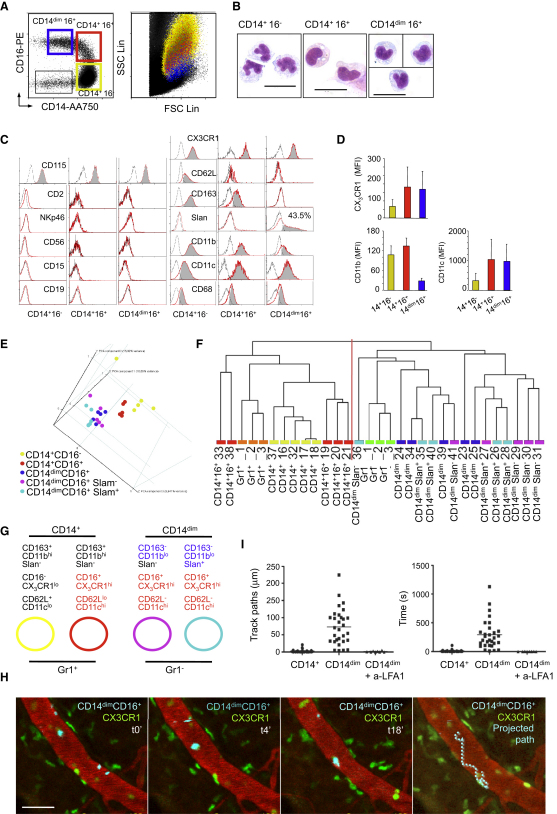
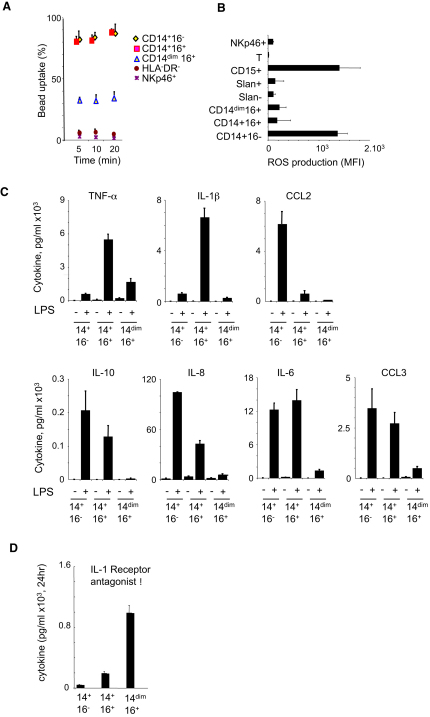
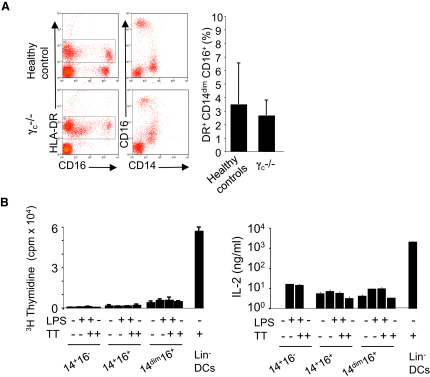
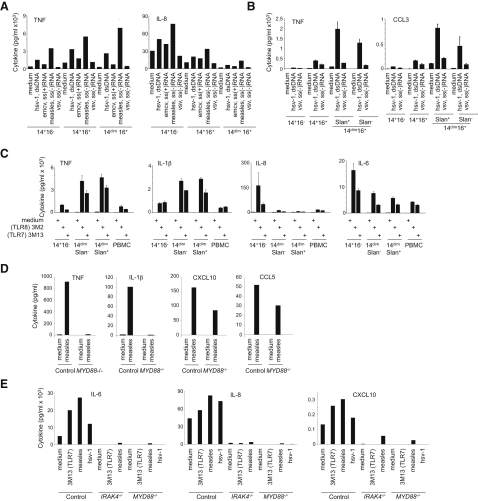
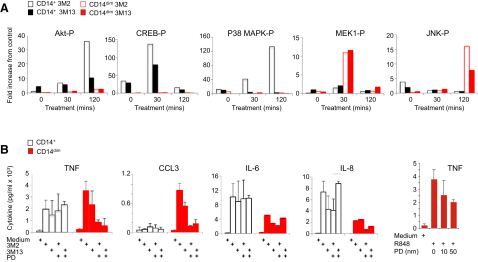
Monocytes are effectors of the inflammatory response to microbes. Human CD14(+) monocytes specialize in phagocytosis and production of reactive oxygen species and secrete inflammatory cytokines in response to a broad range of microbial cues. Here, we have characterized the functions of human monocytes that lack CD14 (CD14(dim)) and express CD16. CD14(dim) monocytes were genetically distinct from natural killer cells. Gene expression analyses indicated similarities with murine patrolling Gr1(dim) monocytes, and they patrolled the endothelium of blood vessels after adoptive transfer, in a lymphocyte function-associated antigen-1-dependent manner. CD14(dim) monocytes were weak phagocytes and did not produce ROS or cytokines in response to cell-surface Toll-like receptors. Instead, they selectively produced TNF-α, IL-1β, and CCL3 in response to viruses and immune complexes containing nucleic acids, via a proinflammatory TLR7-TLR 8-MyD88-MEK pathway. Thus, CD14(dim) cells are bona fide monocytes involved in the innate local surveillance of tissues and the pathogenesis of autoimmune diseases.


Figures

None
Graphical abstract
Figure 1
Figure 1
Phenotype, Expression Arrays, and In Vivo Behavior of Human Monocyte Subsets (A–D) (A) Monocytes are contained within CD115+ cells, or DR+ cells, that do not express B cell (CD19), T cell (CD2), NK cell (NKp46), or granulocyte markers (CD15). Within this gate, large CD14+CD16 and CD14+CD16+ monocytes, small CD14dimCD16+ monocytes, and CD14CD16 dendritic cells can be separated. (A and B) The size, morphology, and (C and D) phenotype of monocytes subsets are shown. The scale bar in (B) represents 20 μm. (E) Principal component analysis (PCA), using probes with significant statistical variation between at least two groups. (F) Hierarchical clustering with the Spearman correlation similarity measure and average linkage in clustering algorithm with probes corresponding to the homologenes and filtering by fold two. (G) Hypothesis generated from biostatistical analysis. In (A) and (D)–(G), monocytes populations are color coded. CD14+CD16 are yellow, CD14+CD16+ are red, and CD14dim CD16 are dark blue. Within CD14dim CD16 cells, Slan+ cells are light blue and Slan cells are magenta. (H) Intravital microscopy of the ear dermis from Cx3cr gfp/+ Rag2−/−Il2rg−/− mice. Blood vessels are labeled by intravenous (i.v.) injection of fluorescent 70 kDa dextran (red), and murine monocytes express gfp (green). CD14dim human monocytes are purified by flow cytometry labeled with DiD (cyan) and injected i.v.; images are stills from Movie S1. The scale bar in (H) represents 50 μm. (I) Dot plots represent the length and duration of crawling CD14+ monocytes (circles) and CD14dimCD16+ monocytes before (squares) and after blocking human LFA-1 (triangles) from nine independent experiments. See also Figure S1 and Movies S1 and S2.
Figure 2
Figure 2
Functional Analysis of Monocyte Subsets Human monocytes were obtained from whole blood from healthy donors and purified by flow cytometry as indicated in the Experimental Procedures (see Figure S1). (A) Percentage of cells that have phagocytosed 1 μm beads after the indicated time. The mean ± SD of triplicates is shown. A representative of five independent experiments is shown. (B) ROS production. (C) Cytokine production after overnight incubation with (+) or without (−) LPS (100 ng/ml). (D) Production of IL1-RA after 18 hr incubation. Bar graphs in (B)–(D) show mean ± SD of triplicates, from experiments representative of three to five donors. See also Figure S2.
Figure 3
Figure 3
Development of Monocytes in γc-Deficient Patient and Antigen Presentation (A) Phenotype of DR+ cells is analyzed by flow cytometry analysis of blood from γc-deficient patient (lacking T, B, and NK cells) versus controls. The bar graph represents the percentage (mean ± SD) of CD14dim monocytes among DR+ cells in three patients and ten controls. (B) Antigen presentation assay. Monocyte subsets and DCs, from a tetanus toxoid-immunized donor were incubated with autologous T cells and tetanus toxoid. Thymidine incorporation measured during the last 18 hr. IL-2 is measured after 4 days. Data in (B) represent the mean ± SD of triplicates, from experiments representative of three donors.
Figure 4
Figure 4
Monocyte Subset-Specific Response to Viruses (A and B) Cytokine production from two different donors after overnight incubation with viruses (A and B) (herpes simplex virus-1 (dsDNA, HSV-1), vesicular stomatitis virus [ss(−)RNA, VSV], measles virus [ss(−)RNA, MV], and Encephalomyocarditis virus [ss(+)RNA, EMCV'. (C) Cytokine production after overnight incubation with TLR agonists. (D and E) Cytokine production by CD14dim monocytes (D) and CD14+ monocytes (E) from controls, MYD88-deficient patients and IRAK-4-deficient patients after exposure to measles virus (MV) or herpes simplex virus-1 (HSV-1). Data are representative of at least three donors. Bar graphs in (A)–(C) show mean (±SD) of triplicates from experiments representative of five healthy donors. Bar graphs in (D) and (E) show results representative of two IRAK−/− patients, three MYD88−/− patients, and ten healthy donors. See also Figure S3.
Figure 5
Figure 5
Monocyte Subset-Specific Activation Pathways (A) Phosphorylated Akt, p38-MAPK, MEK1, and JNK in CD14+(black bars) and CD14lo monocytes (red bars) following treatment with TLR8 agonist (3M2, open bars) or TLR7 agonist (3M13, closed bars) for 0, 30, and 120 min at 37°C. Data are presented as mean fold increase from vehicle control treated cells from three independent experiments. (B) Cytokine production by CD14+ (open black bars) and CD14dim (closed red bars) monocytes treated with vehicle, 3M2, or 3M13 with or without MEK inhibitor PD98059. Data are presented as mean ± SD in expression (pg/ml) from three independent experiments. See also Figure S4.
Figure 6
Figure 6
CD14dim Monocytes Detect Nucleic Acids and Mediate Inflammation in Lupus Patients (A) Immunostaining for IgG, CD68, CD16, CD14, CD15, and CD3ɛ, on tissue sections from kidney biopsy with IV-G lupus glomerulonephritis (left panels) and postinfectious glomerulonephritis (right panels). (B) Cytokine production by CD14dim or CD14+ monocytes from healthy controls (n = 3) incubated with serum from Lupus patients with autoantibodies to RNPs (n = 3) and controls (n = 2). (C and D) Monocyte cytokine production after incubation with serum from patients without treatment (open bar), RNase+DNase treatment (red bar), addition of RNP (light yellow bar), depletion of immunoglobulins (green bar), depletion of immunoglobulins+RNP (blue bar), or depletion of immunoglobulins+RNase+DNase (orange bar). Two representative figures for each cytokine from at least three experiments are shown. p < 0.01 for comparison RNP versus other treatments (one-way ANOVA).

Comment in

References

    1. Agrawal A., Dillon S., Denning T.L., Pulendran B. ERK1-/- mice exhibit Th1 cell polarization and increased susceptibility to experimental autoimmune encephalomyelitis. J. Immunol. 2006;176:5788–5796. - PubMed
    1. Ancuta P., Rao R., Moses A., Mehle A., Shaw S.K., Luscinskas F.W., Gabuzda D. Fractalkine preferentially mediates arrest and migration of CD16+ monocytes. J. Exp. Med. 2003;197:1701–1707. - PMC - PubMed
    1. Ancuta P., Kunstman K.J., Autissier P., Zaman T., Stone D., Wolinsky S.M., Gabuzda D. CD16+ monocytes exposed to HIV promote highly efficient viral replication upon differentiation into macrophages and interaction with T cells. Virology. 2006;344:267–276. - PubMed
    1. Ancuta P., Liu K.Y., Misra V., Wacleche V.S., Gosselin A., Zhou X., Gabuzda D. Transcriptional profiling reveals developmental relationship and distinct biological functions of CD16+ and CD16- monocyte subsets. BMC Genomics. 2009;10:403. - PMC - PubMed
    1. Auffray C., Fogg D., Garfa M., Elain G., Join-Lambert O., Kayal S., Sarnacki S., Cumano A., Lauvau G., Geissmann F. Monitoring of blood vessels and tissues by a population of monocytes with patrolling behavior. Science. 2007;317:666–670. - PubMed

Publication types