. 2010 Nov 23;50(23):2445-54.
doi: 10.1016/j.visres.2010.09.004. Epub 2010 Sep 9.

Spatial frequency discrimination learning in normal and developmentally impaired human vision

Affiliations

Spatial frequency discrimination learning in normal and developmentally impaired human vision

Andrew T Astle et al. Vision Res. .

Abstract

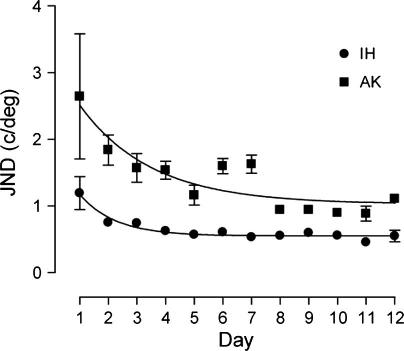
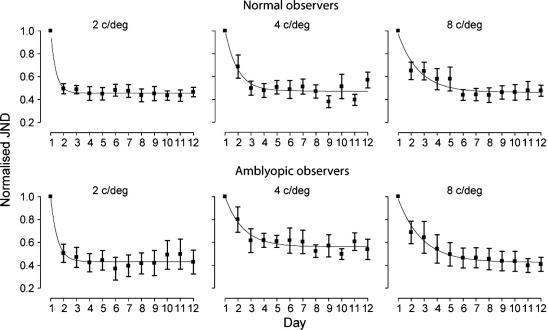
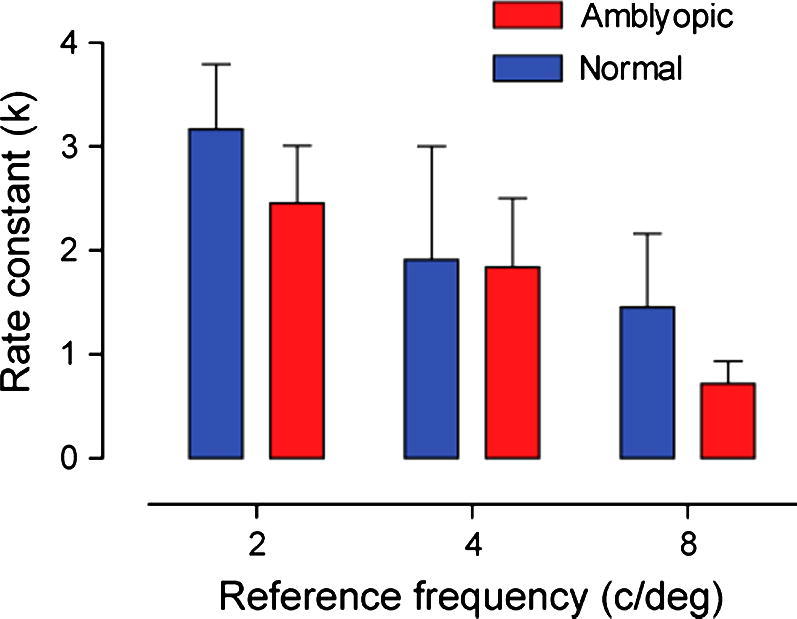
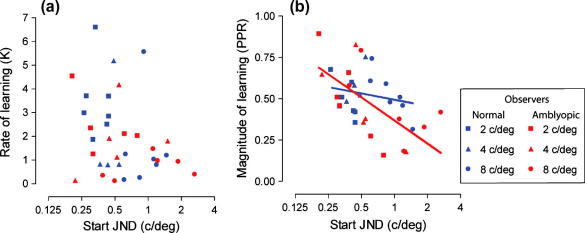
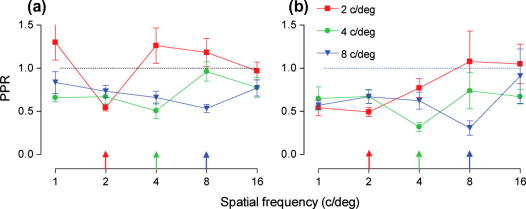
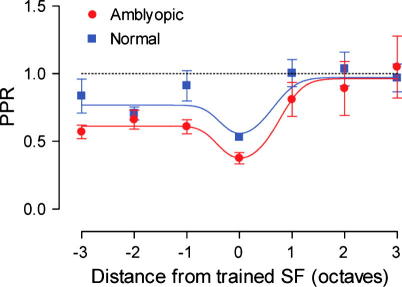
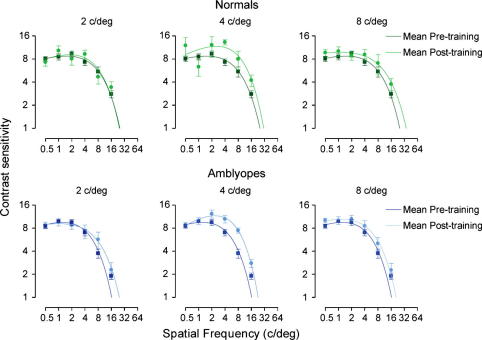
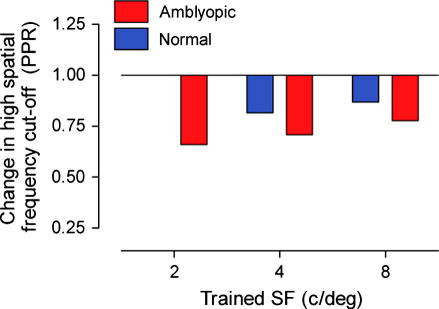
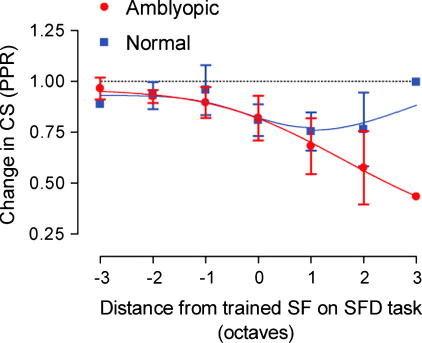
Perceptual learning effects demonstrate that the adult visual system retains neural plasticity. If perceptual learning holds any value as a treatment tool for amblyopia, trained improvements in performance must generalize. Here we investigate whether spatial frequency discrimination learning generalizes within task to other spatial frequencies, and across task to contrast sensitivity. Before and after training, we measured contrast sensitivity and spatial frequency discrimination (at a range of reference frequencies 1, 2, 4, 8, 16 c/deg). During training, normal and amblyopic observers were divided into three groups. Each group trained on a spatial frequency discrimination task at one reference frequency (2, 4, or 8 c/deg). Normal and amblyopic observers who trained at lower frequencies showed a greater rate of within task learning (at their reference frequency) compared to those trained at higher frequencies. Compared to normals, amblyopic observers showed greater within task learning, at the trained reference frequency. Normal and amblyopic observers showed asymmetrical transfer of learning from high to low spatial frequencies. Both normal and amblyopic subjects showed transfer to contrast sensitivity. The direction of transfer for contrast sensitivity measurements was from the trained spatial frequency to higher frequencies, with the bandwidth and magnitude of transfer greater in the amblyopic observers compared to normals. The findings provide further support for the therapeutic efficacy of this approach and establish general principles that may help develop more effective protocols for the treatment of developmental visual deficits.


Figures

Fig. 1
Fig. 1
Example learning curves for two observers that trained on a spatial frequency discrimination task at a reference frequency of 8 c/deg. Observer IH (circles) has normal vision, observer AK (squares) is amblyopic. Error bars represent the standard error of the mean (SEM). Smooth curves through the data points are the best fitting solutions of Eq. (2).
Fig. 2
Fig. 2
Mean normalised learning curves for the different spatial frequency training groups. Mean performance for each group has been normalised such that the mean JND on day 1 (pre-training) was set to unity. Error bars represent SEM. Smooth curves through the data points are the best fitting solutions of Eq. (2).
Fig. 3
Fig. 3
The rate of learning for each subject group, at each of the three reference training spatial frequencies (2, 4 and 8 c/deg). A higher k-value represents a more rapid rate of learning. Error bars represent SEM.
Fig. 4
Fig. 4
Scatterplots showing (a) rate of learning and (b) magnitude of learning versus start JND for all normal (blue symbols) and amblyopic observers (red symbols). There is no obvious relationship between the rate of learning and each observer’s individual threshold at the start of training. In contrast, the magnitude of learning is proportional to starting threshold, particularly for the amblyopic observers. Data in (b) were fitted with the following equation: y = m × ln (x) + c where y is the magnitude of learning, m is the slope of the curve, x is the start JND and c is a constant. The slope of the amblyopic observer curve differs significantly from zero (slope = −0.20; 95% CI, −0.33 to −0.07) but that of the normal observer curve does not (slope = −0.06; 95% CI, −0.18 to 0.07).
Fig. 5
Fig. 5
Pre–post ratio plotted against spatial frequency for (a) normal observers and (b) amblyopic observers. Points lying below the dotted line (PPR = 1) denote an improvement in performance. Error bars represent SEM.
Fig. 6
Fig. 6
PPR data for normal (blue squares) and amblyopic (red circles) observers collapsed across trained spatial frequency. Points lying below the dotted line (PPR = 1) denote an improvement in performance. Error bars represent SEM. Both groups show more transfer of learning to frequencies lower than the trained spatial frequency. Smooth curves through the data points are the best fitting solutions of Eq. (4).
Fig. 7
Fig. 7
Mean contrast sensitivity functions for each of the training groups before and after spatial frequency discrimination training. Error bars represent SEM. Smooth curves through the data points are the best fitting solutions of Eq. (3).
Fig. 8
Fig. 8
Change in contrast sensitivity expressed as a ratio (PPR) of high-frequency cut-off values for each of the training groups before and after spatial frequency discrimination training. The normal group that trained at 2 c/deg showed no transfer of learning between tasks. However, all other training groups showed improvements in this measure.
Fig. 9
Fig. 9
Transfer of learning from spatial frequency discrimination to contrast sensitivity (CS). Pre–post ratio (PPR) is plotted as a relative distance (in octaves) from the spatial frequency (SF) at which observers were trained on the spatial frequency discrimination (SFD) task. PPR values were calculated from the fit to the mean group data shown in Fig. 7 (ratio of CS prior to SFD training to CS after training). Error bars represent SEM. No error bars are shown at 3 octaves, since only one PPR value contributes to this point for both the amblyopic and normal observers (CS at 16 c/deg for groups trained at 2 c/deg). Smooth curves through the data points are the best fitting solutions of Eq. (4).

References

    1. Ahissar M., Hochstein S. Task difficulty and the specificity of perceptual learning. Nature. 1997;387:401–406. - PubMed
    1. Ahissar M., Hochstein S. The reverse hierarchy theory of visual perceptual learning. Trends in Cognitive Sciences. 2004;8:457–464. - PubMed
    1. Attebo K., Mitchell P., Smith W. Visual acuity and the causes of visual loss in Australia. The Blue Mountains Eye Study. Ophthalmology. 1996;103:357–364. - PubMed
    1. Barnes G.R., Hess R.F., Dumoulin S.O., Achtman R.L., Pike G.B. The cortical deficit in humans with strabismic amblyopia. The Journal of Physiology. 2001;533:281–297. - PMC - PubMed
    1. Buonomano D.V., Merzenich M.M. Cortical plasticity: From synapses to maps. Annual Review of Neuroscience. 1998;21:149–186. - PubMed

Publication types