. 2010 Sep 10;39(5):700-10.
doi: 10.1016/j.molcel.2010.08.017.

Comprehensive, fine-scale dissection of homologous recombination outcomes at a hot spot in mouse meiosis

Affiliations

Comprehensive, fine-scale dissection of homologous recombination outcomes at a hot spot in mouse meiosis

Francesca Cole et al. Mol Cell. .

Abstract

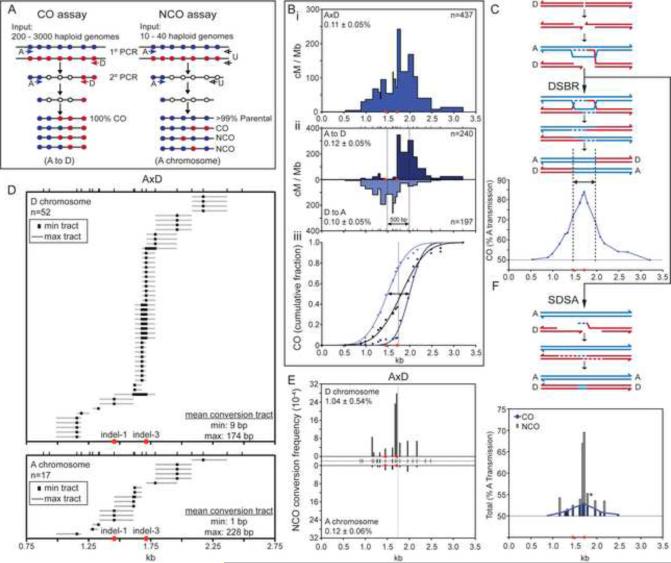
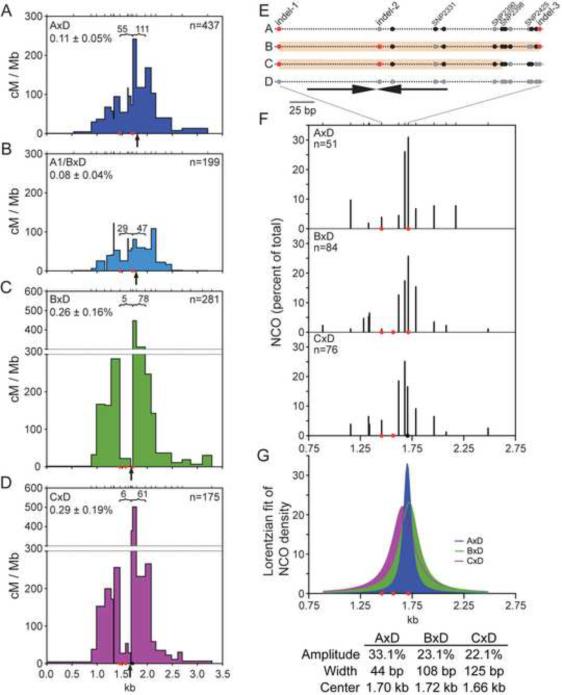
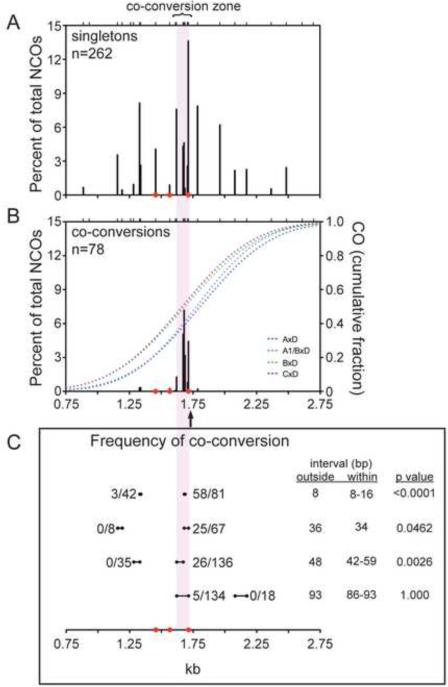
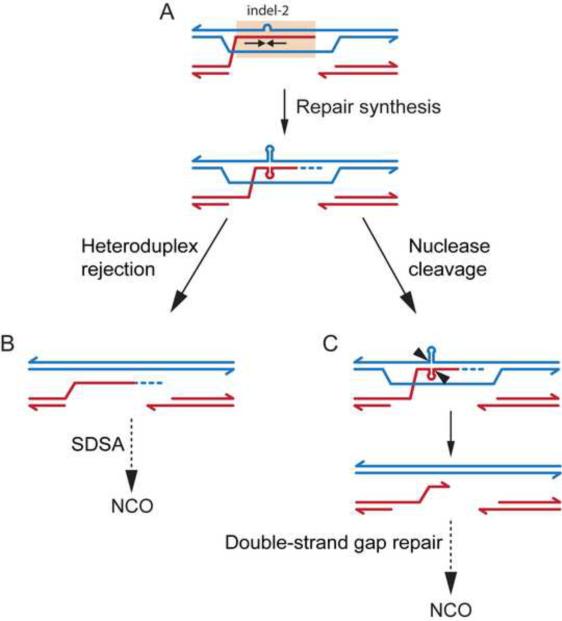
In mammalian meiosis, only a small fraction of programmed DNA double-strand breaks are repaired as interhomolog crossovers (COs). To analyze another product of meiotic recombination, interhomolog noncrossovers (NCOs), we performed high-resolution mapping of recombination events at an intensely active mouse hot spot in F1 hybrids derived from inbred mouse strains. We provide direct evidence that the vast majority of repair events are interhomolog NCOs, consistent with models in which frequent interhomolog interactions promote accurate chromosome pairing. NCOs peaked at the center of the hot spot but were also broadly distributed throughout. In some hybrid strains, localized zones within the hot spot were highly refractory to COs and showed elevated frequency of coconversion of adjacent polymorphisms in NCOs, raising the possibility of double-strand gap repair. Transmission distortion was observed in one hybrid, with NCOs providing a significant contribution. Thus, NCO recombination events play a substantial role in mammalian meiosis and genome evolution.


Figures

Figure 1
Figure 1. Recombination initiation bias for COs and NCOs in A×D results in transmission distortion
(A) PCR strategy to amplify COs and NCOs at the A3 hotspot. Only one orientation is shown. Filled circles, polymorphisms on the A (A/J, blue) or D (DBA/2J, red) chromosome; filled arrows, allele-specific primers; open arrows, universal primers (U). (B) CO breakpoints cluster in a 1.5 kb region, defining the A3 hotspot. (i) Total CO breakpoint map is shown. (ii) The CO breakpoint maps in the A to D (top) and D to A (bottom) orientations are shifted relative to each other, indicating reciprocal CO asymmetry. Vertical lines represent the midpoint for each orientation, as determined from the cumulative distributions (iii). The distance between the midpoints provides an estimate of the mean CO gene conversion tract length (500 bp, arrow). The vertical line in panel iii represents the average midpoint of CO gene conversion tracts, as determined from the midpoints for the two orientations. Numbers of COs examined and Poisson-adjusted CO frequencies (± S.D.) are indicated. Ticks represent positions of the 20 tested polymorphisms. Red circles, indels (see Figure S2D, E). (C) Transmission distortion from COs in favor of the A chromosome arising from preferential DSB formation on the D chromosome (red) with the A chromosome (blue) serving as the donor of genetic information for DSBR. Only one chromatid from each homolog is shown for simplicity. The vertical lines represent the midpoints of the CO distributions for each orientation, as in (Bii). (D) NCO gene conversion tracts on the D (top) and A (bottom) chromosomes. (E) NCO frequencies for A×D are 10-fold higher than CO frequencies, with the D chromosome showing 9-fold more NCOs than the A chromosome. Total Poisson-adjusted NCO frequencies are indicated. NCO frequencies at each tested polymorphism are normalized for co-conversions. Ticks in the center represent the 19 polymorphisms tested. The vertical line represents the average midpoint of CO gene conversion tracts, as in (Biii). (F) Transmission distortion in favor of the A chromosome derived from NCOs (gray bars) and COs (blue bars, derived from Figure 1C). Transmission distortion from NCOs arises from preferential DSB formation on the D chromosome (red) with the A chromosome (blue) serving as the donor of genetic information for SDSA.
Figure 2
Figure 2. B×D shows CO refraction, but not biased recombination initiation
(A) CO breakpoint maps from B×D in the B to D (top) and D to B (bottom) orientations. The CO refractory zone (salmon shading), is indicated. Ticks represent positions of the 16 tested polymorphisms. (B) Cumulative CO distributions for all COs and for each orientation. (C) NCO frequencies for the D (top) and B (bottom) chromosomes indicate similar frequencies of recombination initiation on both chromosomes. Ticks in the center represent the polymorphisms tested (20 and 16 for the D and B chromosome, respectively). The vertical line represents the midpoint of the total CO distribution, as in Figure 2B. (D) NCO gene conversion tracts on the D chromosome, depicted as in Figure 1D. See Figure S4 for the B chromosome.
Figure 3
Figure 3. CO refraction is linked to Chr 1 and is associated with a wider NCO distribution
(A–D) Total CO breakpoint maps for the indicated hybrids. The number of CO breakpoints mapped to the regions indicated by brackets is given. The leftmost of these regions encompasses the CO refractory zone in B×D, except in panel D, where it encompasses the slightly shifted CO refractory zone in C×D. Breakpoints within the CO refractory zone are significantly reduced for B×D and C×D relative to either A×D or A1/B×D, p<0.0001 (Fisher's exact test). Arrows, midpoints of total CO breakpoints for each hybrid; red circles, indels; black circle, SNP2425. (E) Schematic of polymorphisms for the A, B, or C versus D haplotypes in the area of the CO refractory zone. The three indels and the SNPs mentioned in the text are labeled, with the location of the ~140 bp inverted repeat indicated (arrows). Polymorphisms of the D genotype are shown in gray; SNPs differing from D are in black and insertions are in red. The CO refractory zones for B×D and C×D are shown with salmon shading on the B and C chromosomes, respectively. (F) Comparison of NCO distributions for the D chromosome in the indicated hybrids. Only polymorphisms (ticks) shared by all three hybrids are plotted. NCOs are expressed as a percent of total and normalized for co-conversions. (G) Lorentzian fit of the NCO distributions (F) showing an increased width for B×D and C×D compared with A×D. A slight shift to the left is observed for the C×D distribution. The amplitude (Amp), width, and the center of the fitted distributions are indicated.
Figure 4
Figure 4. Co-conversions in NCOs are enriched in the central 100 bp of the hotspot
Compilation of NCOs with conversion of only a single polymorphism (singletons) (A) and co-conversions (B) for A3, plotted as a percent of total NCOs. Values are Poisson adjusted. The 100-bp zone enriched for co-conversions is indicated by the lilac shading. NCOs are derived from all chromosomes tested except the A chromosome. (B) CO breakpoint cumulative distributions (right y-axis) for the indicated hybrids are also plotted; the arrow indicates the midpoint for all of the CO breakpoints. (C) Comparison of the frequency of co-conversion within and outside of the co-conversion zone. Intervals of similar sizes are compared for the number of co-conversions relative to total conversions involving one or both polymorphisms. Interval sizes within the co-conversion zone may differ slightly between hybrids because of polymorphism variation. Co-conversions outside and within the co-conversion zone were compared using a Fisher's exact test.
Figure 5
Figure 5. CO refraction models
(A) Spo11-generated DSB formation is inferred to occur most often to the right of the CO refractory zone (salmon shading). Strand invasion generates heteroduplex DNA encompassing the imperfect inverted repeat (arrows), with indel-2 near the center. DNA repair synthesis causes torsional stress resulting in cruciform extrusion. (B) Heteroduplex rejection favors NCOs at the expense of COs. Recognition of the aberrant secondary structure by a helicase promotes dissociation of the invading strand and leads to SDSA, generating an NCO. (C) Nuclease cleavage leading to double-strand gap formation. Cleavage by a structure-specific nuclease, followed by dissociation, results in a double-strand gap which extends from the base of the inverted repeat to the Spo11 DSB site. Gap repair without reciprocal exchange generates an NCO with a longer gene conversion tract than normal, incorporating multiple polymorphisms (i.e., co-conversions).

Similar articles

Cited by

References

    1. Arnheim N, Calabrese P, Tiemann-Boege I. Mammalian meiotic recombination hot spots. Annu Rev Genet. 2007;41:369–399. - PubMed
    1. Baudat F, Buard J, Grey C, Fledel-Alon A, Ober C, Przeworski M, Coop G, de Massy B. PRDM9 is a major determinant of meiotic recombination hotspots in humans and mice. Science. 2010;327:836–840. - PMC - PubMed
    1. Baudat F, de Massy B. Cis- and trans-acting elements regulate the mouse Psmb9 meiotic recombination hotspot. PLoS Genet. 2007a;3:e100. - PMC - PubMed
    1. Baudat F, de Massy B. Regulating double-stranded DNA break repair towards crossover or non-crossover during mammalian meiosis. Chromosome Res. 2007b;15:565–577. - PubMed
    1. Baudat F, de Massy B. Parallel detection of crossovers and noncrossovers in mouse germ cells. Methods Mol Biol. 2009;557:305–322. - PubMed

Publication types

LinkOut - more resources