Comment
. 2010 Sep 14;18(3):282-93.
doi: 10.1016/j.ccr.2010.08.013.

Modulation of K-Ras-dependent lung tumorigenesis by MicroRNA-21

Affiliations
Comment

Modulation of K-Ras-dependent lung tumorigenesis by MicroRNA-21

Mark E Hatley et al. Cancer Cell. .

Abstract

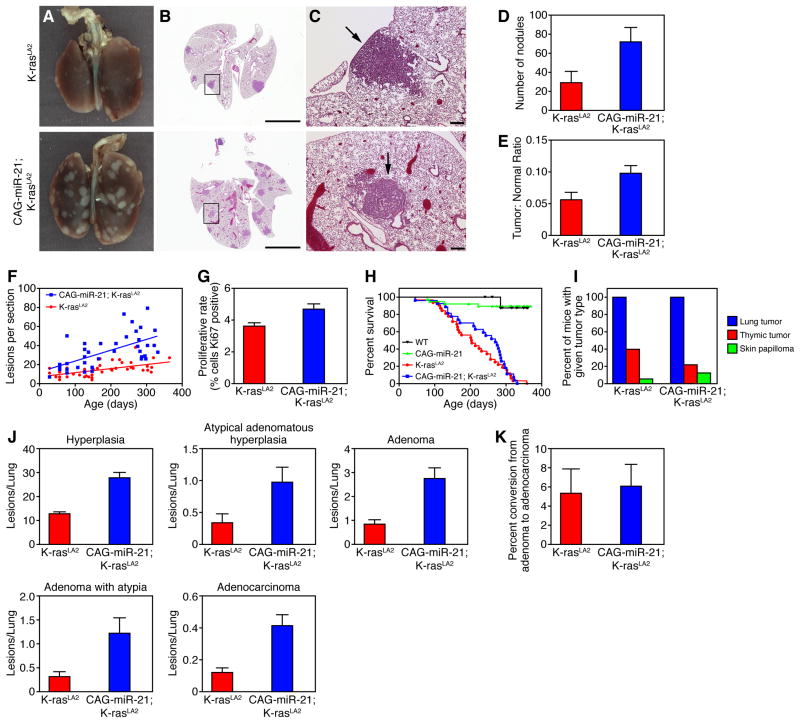
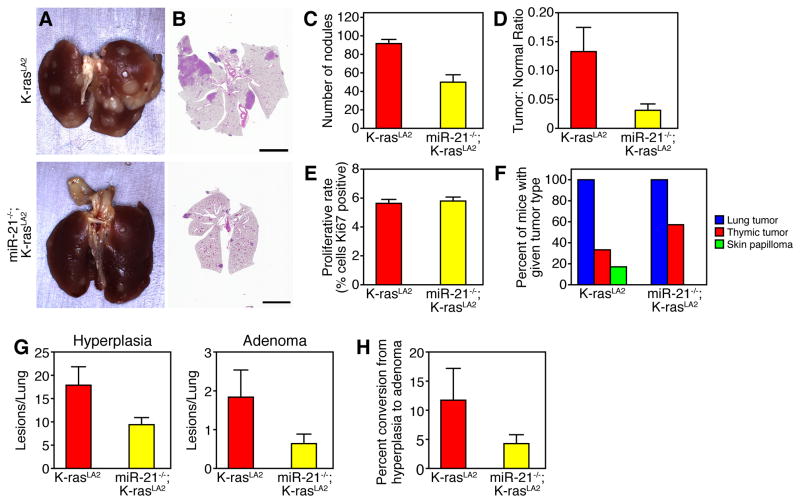
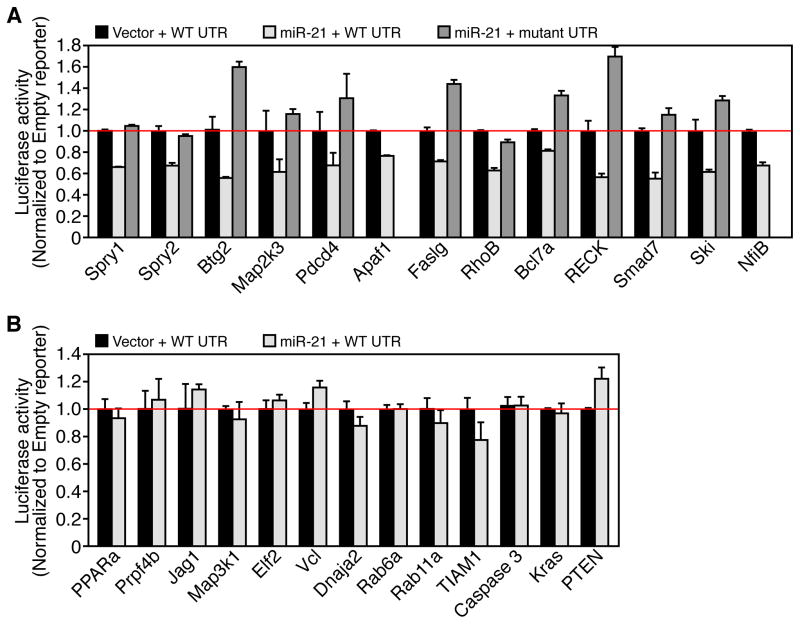
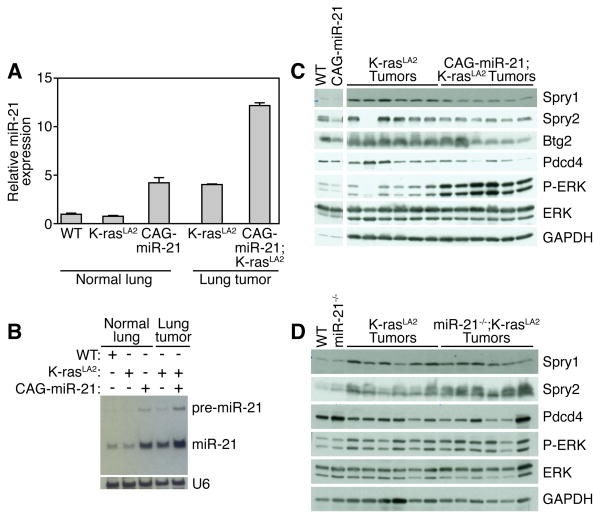
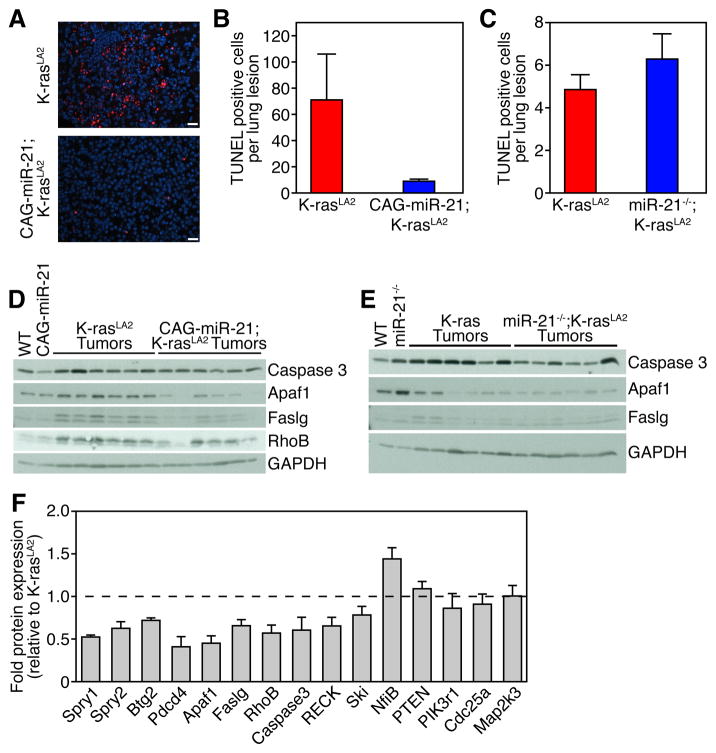
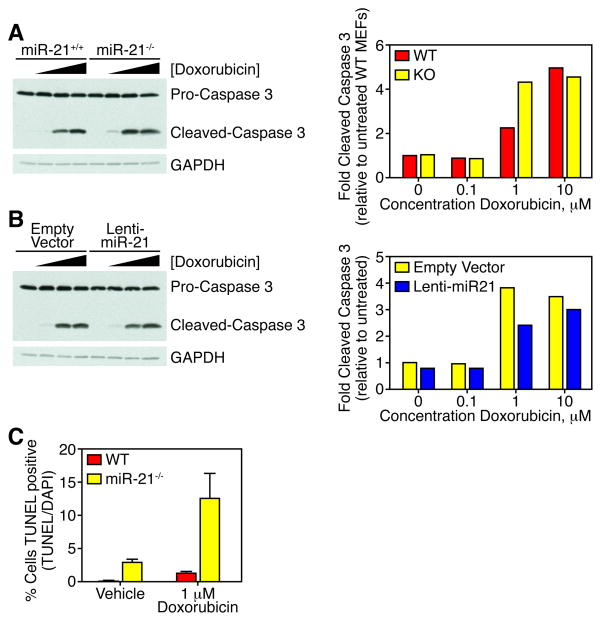
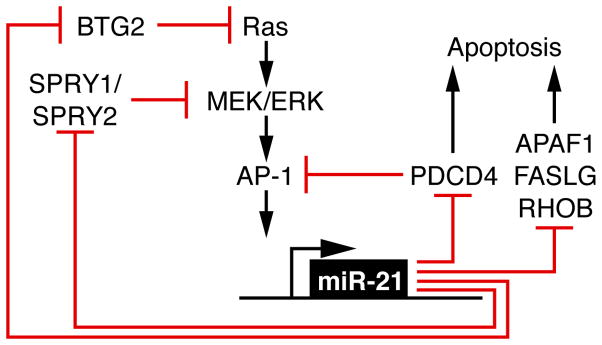
Lung cancer is the leading cause of cancer-related deaths in the world, and non-small-cell lung cancer (NSCLC) accounts for 80% of cases. MicroRNA-21 (miR-21) expression is increased and predicts poor survival in NSCLC. Although miR-21 function has been studied in vitro with cancer cell lines, the role of miR-21 in tumor development in vivo is unknown. We utilize transgenic mice with loss-of-function and gain-of-function miR-21 alleles combined with a model of NSCLC to determine the role of miR-21 in lung cancer. We show that overexpression of miR-21 enhances tumorigenesis and that genetic deletion of miR-21 partially protects against tumor formation. MiR-21 drives tumorigenesis through inhibition of negative regulators of the Ras/MEK/ERK pathway and inhibition of apoptosis.


Figures

Figure 1
Figure 1. miR-21 over-expression enhances tumor formation in the K-rasLA2 mouse model of NSCLC
(A) Gross and (B, C) cross sectional H&E histology of lungs isolated from CAG-miR-21;K-rasLA2 mice and K-rasLA2 littermate controls at 18 weeks of age. (C) Magnification of boxed lesions in (B). Arrows in top and bottom panels indicate a hyperplastic lesion and adenoma, respectively. Scale bars, (B) 5 mm, (C) 200 μm. (D) Nodules grossly visible were counted on the lung surface of CAG-miR-21;K-rasLA2 (n = 5) and K-rasLA2 (n = 4) mice sacrificed at 18 weeks of age. Results are mean ± SEM. P value 0.013 using two-tailed, unpaired Student’s t-test. (E) Tumor burden measured as the ratio of total tumor area to total lung area of the lungs counted in (D). Results are mean ± SEM. P value 0.045 using two-tailed, unpaired Student’s t-test. (F) Quantification of tumor lesions on lung H&E cross-section from CAG-miR-21;K-rasLA2 (n = 49) and K-rasLA2 (n = 40) mice over time. Slopes were determined by linear regression, P value 0.0027. (G) Quantification of proliferating cells detected by Ki67 antibody immunostaining of lung tumors. Results are mean ± SEM (n = 12). P value 0.01 by two-tailed, unpaired Student’s t-test. (H) Survival curve of CAG-miR-21;K-rasLA2 (n = 27) and K-rasLA2 (n = 32) mice (P = 0.367) with median survival of 270 and 203 days, respectively. WT (n = 10), CAG-miR-21 (n = 20). (I) Tumor spectra in CAG-miR-21;K-rasLA2 (n = 27) and K-rasLA2 mice (n = 32). (J) Lung H&E cross sections from mice in the survival cohort were analyzed and all lesions were classified for tumor grade. CAG-miR-21;K-rasLA2 (n = 27), K-rasLA2 (n = 32). Hyperplasia, P value < 0.0001. Atypical adenomatous hyperplasia, P value 0.017. Adenoma, P value < 0.0001. Adenoma with atypia, P value 0.0042. Adenocarcinoma, P value 0.033. All data represented as the mean ± SEM of the number of lesions per lung. (K) Rate of conversion of adenoma to adenocarcinoma, data represented as mean ± SEM, P value 0.83. See also Figure S1.
Figure 2
Figure 2. miR-21 deletion suppresses tumorigenesis in K-rasLA2 model of NSCLC
(A) Gross and (B) cross sectional H&E histology of lungs isolated from miR-21/;K-rasLA2 and K-rasLA2 mice at 20 weeks of age. Scale bar, 5 mm. (C) Quantification of nodules grossly visible on the lung surface of miR-21/minus;;K-rasLA2 (n = 5) and K-rasLA2 (n = 3) mice at 20 weeks of age. Results are mean ± SEM. P value 0.008 using two-tailed, unpaired Student’s t-test. (D) Tumor burden measured as the ratio of total tumor area to total lung area of the lungs counted in (C). Results are mean ± SEM. P value 0.015 using two-tailed, unpaired Student’s t-test. (E) Quantification of proliferating cells detected by Ki67 antibody immunostaining of lung tumors. Results are mean + SEM (n = 6). P value 0.4 by two-tailed, unpaired Student’s t-test. (F) Tumor spectra in K-rasLA2 and miR-21−/−;K-rasLA2 mice. (G) Lung H&E cross sections from miR-21−/−;K-rasLA2 (n = 14), K-rasLA2 (n = 6) mice were analyzed and all lesions were classified for tumor grade. Hyperplasia, P value 0.023. Adenoma, P value 0.057. All data represented as the mean ± SEM of the number of lesions per lung. (H) Rate of conversion of hyperplasia to adenoma. Data represented as mean ± SEM, P value 0.089. See also Figure S2.
Figure 3
Figure 3. miR-21 targets mRNAs encoding multiple tumor suppressors
(A) Luciferase activity in COS cells co-transfected with miR-21 or control vector and miR-21 responsive target gene 3′ UTRs or miR-21 site mutant 3′ UTR luciferase reporters. Data represented as mean ± SEM and normalized to empty vector (no miR-21) control. n = 4. (B) Luciferase activity in COS cells cotransfected with miR-21 or empty vector and indicated miR-21 unresponsive 3′ UTRs. Data represented as mean ± SEM and normalized to empty vector (no miR-21) control. n = 4.
Figure 4
Figure 4. miR-21 induction by oncogenic K-ras represses negative regulators of the Ras/MEK/ERK pathway
(A) MiR-21 expression in lung tumors from CAG-miR-21;K-rasLA2 and K-rasLA2 mice (after K-ras activation) compared to normal lung from wild-type, K-rasLA2 (prior to K-ras activation) and CAG-miR-21 by realtime PCR. Results are mean ± SEM. (B) Northern blot analysis of miR-21 expression in lung tumors from CAG-miR-21;K-rasLA2 and K-rasLA2 mice (after K-ras activation) compared to normal lung from wild-type, K-rasLA2 (prior to K-ras activation) and CAG-miR-21. (C) Western blot analysis of lung lysates from normal lung from wild-type (WT) and CAG-miR-21 mice and six isolated lung tumors from CAG-miR-21;K-rasLA2 and K-rasLA2 mice. Antibodies used are shown on right. (D) Western blot analysis of lung lysates from wild-type (WT) and miR-21−/− mice and six isolated tumors from miR-21−/−;K-rasLA2 and K-rasLA2 mice. Antibodies used are shown on right. See also Figure S3.
Figure 5
Figure 5. miR-21 reduces apoptosis through targeting multiple apoptotic modulators. (A) TUNEL staining of K-rasLA2 and CAG-miR-21;K-rasLA2 tumors. Scale bars 20 μm
(B) Quantification of TUNEL positive nuclei per lung tumor. K-rasLA2 (n = 16) and CAG-miR-21;K-rasLA2 (n = 62). Results are mean ± SEM. P value 0.007 by unpaired, two-tailed Student’s t-test. (C) Quantification of TUNEL staining in miR-21−/−;K-rasLA2 and K-rasLA2 controls. K-rasLA2 (n = 42) and miR-21−/−;K-rasLA2 (n = 22). Results are mean ± SEM. P value 0.28 using unpaired, two-tailed Student’s t-test. (D) Western blot analysis of lung lysates from wild-type (WT) and CAG-miR-21 mice and six isolated lung tumors from CAG-miR-21;K-rasLA2 and K-rasLA2 mice. Antibodies used are shown on right. (E) Western blot analysis of lung lysates from WT and miR-21−/− mice and six isolated lung tumors from miR-21−/−;K-rasLA2 and K-rsLA2 mice. Antibodies are shown on right. (F) Quantification of protein expression from Western blots shown in Figure 4C, Figure 5D, and Figure S3A and S3B. Bar values indicate the mean ± SEM of protein levels in six independent tumors from CAG-miR-21;K-rasLA2 mice after normalization to Gapdh and represented as fraction of the protein levels in the K-rasLA2 controls. Dashed line indicates the protein level in K-rasLA2 tumors.
Figure 6
Figure 6. miR-21 deletion sensitizes cells to doxorubicin-induced apoptosis
(A) Western blot analysis (left panel) for cleaved caspase 3 in protein lysates from wild-type and miR-21−/− MEFs immortalized with T-Ag, transformed with H-rasV12, and treated with increasing concentrations of doxorubicin. Antibodies used are shown on right. Quantification of cleaved caspase 3 levels normalized to pro-caspase 3 and represented relative to untreated wild-type MEFs (right panel). (B) Western blot analysis (left panel) for cleaved caspase 3 in protein lysates from miR-21−/− MEFs immortalized with T-Ag, transformed with H-rasV12, and transduced with lentivirus expressing miR-21 (lenti-miR-21) or empty vector, and treated with increasing concentrations of doxorubicin. Antibodies used are shown on right. Quantification of cleaved caspase 3 levels normalized to pro-caspase 3 and represented relative to untreated wild-type MEFs (right panel). (C) TUNEL assay of wild-type and miR-21−/− MEFs treated with vehicle or 1 μM doxorubicin for 12 hours. Data represented as mean ± SEM, n = 6. See also Figure S4.
Figure 7
Figure 7
Proposed model showing that miR-21 potentiates oncogenic Ras signaling and attenuates apoptosis through repression of multiple tumor suppressors, miR-21 target genes.

Comment on

References

    1. Afonja O, Juste D, Das S, Matsuhashi S, Samuels HH. Induction of PDCD4 tumor suppressor gene expression by RAR agonists, antiestrogen and HER-2/neu antagonist in breast cancer cells. Evidence for a role in apoptosis. Oncogene. 2004;23:8135–8145. - PubMed
    1. Asangani IA, Rasheed SA, Nikolova DA, Leupold JH, Colburn NH, Post S, Allgayer H. MicroRNA-21 (miR-21) post-transcriptionally downregulates tumor suppressor Pdcd4 and stimulates invasion, intravasation and metastasis in colorectal cancer. Oncogene 2007 - PubMed
    1. Badillo-Almaraz I, Badillo-Salas C, Villalobos R, Avalos-Diaz E, Herrera-Esparza R. Defective expression of FasL and Bax in human lung cancer. Clin Exp Med. 2003;3:106–112. - PubMed
    1. Baek D, Villen J, Shin C, Camargo FD, Gygi SP, Bartel DP. The impact of microRNAs on protein output. Nature. 2008;455:64–71. - PMC - PubMed
    1. Bartel DP. MicroRNAs: genomics, biogenesis, mechanism, and function. Cell. 2004;116:281–297. - PubMed

Publication types

MeSH terms