

Early assessment of treatment response in patients with AML using [(18)F]FLT PET imaging
- PMID: 20832860
- PMCID: PMC3319294
- DOI: 10.1016/j.leukres.2010.06.010
Early assessment of treatment response in patients with AML using [(18)F]FLT PET imaging
Abstract
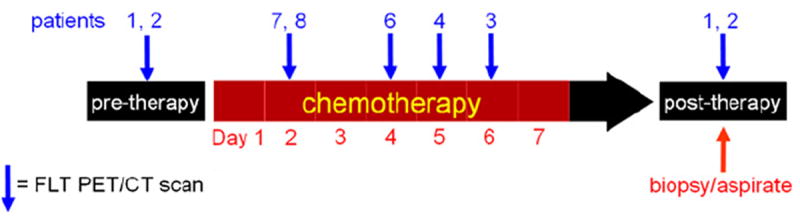
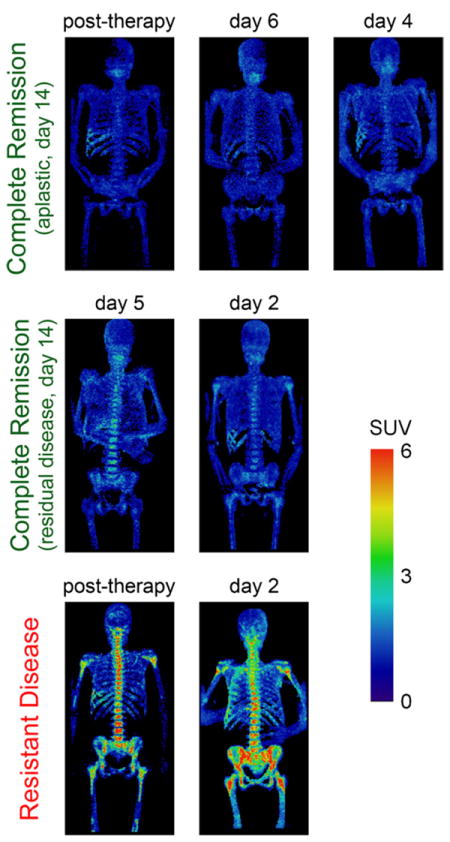
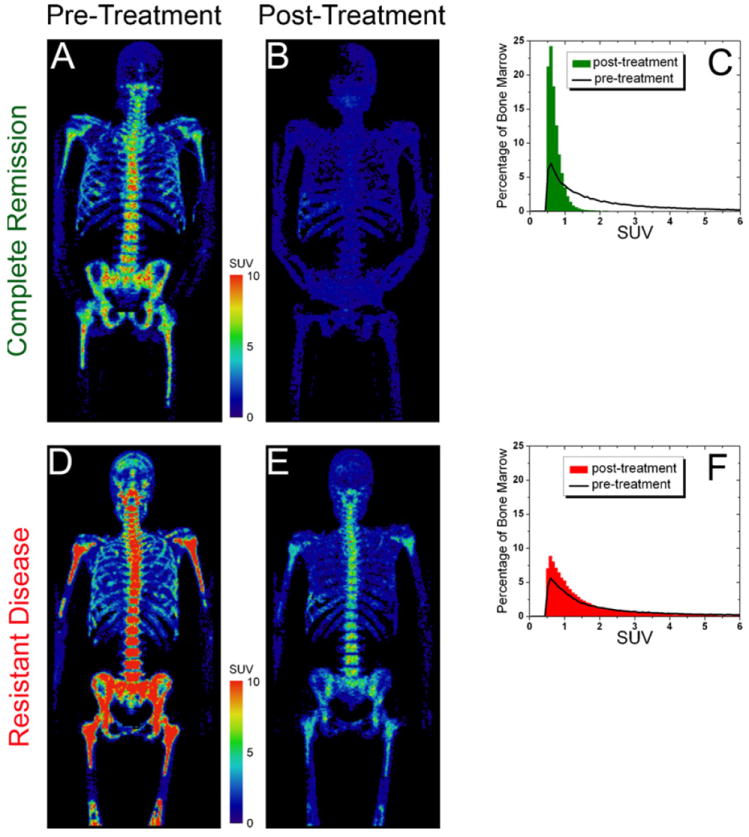
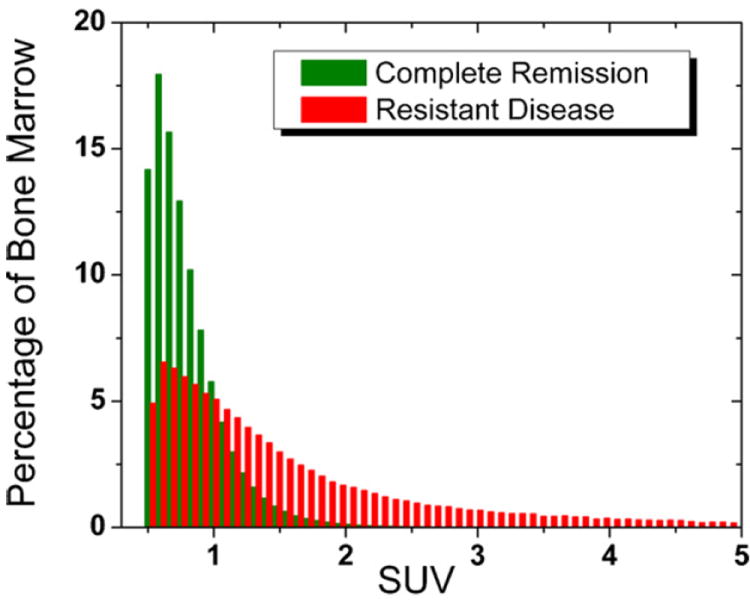
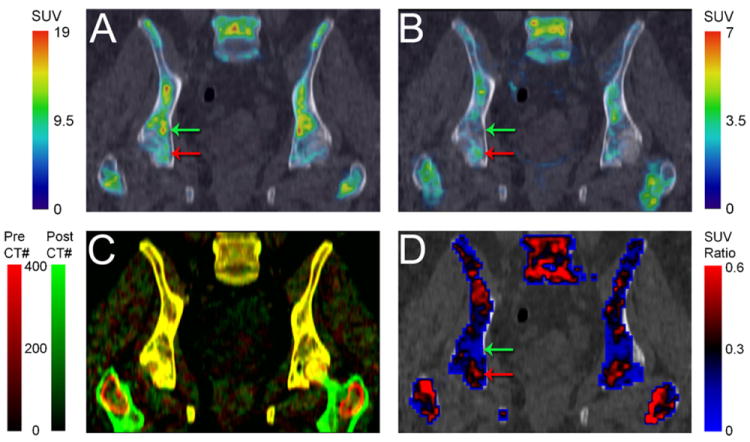
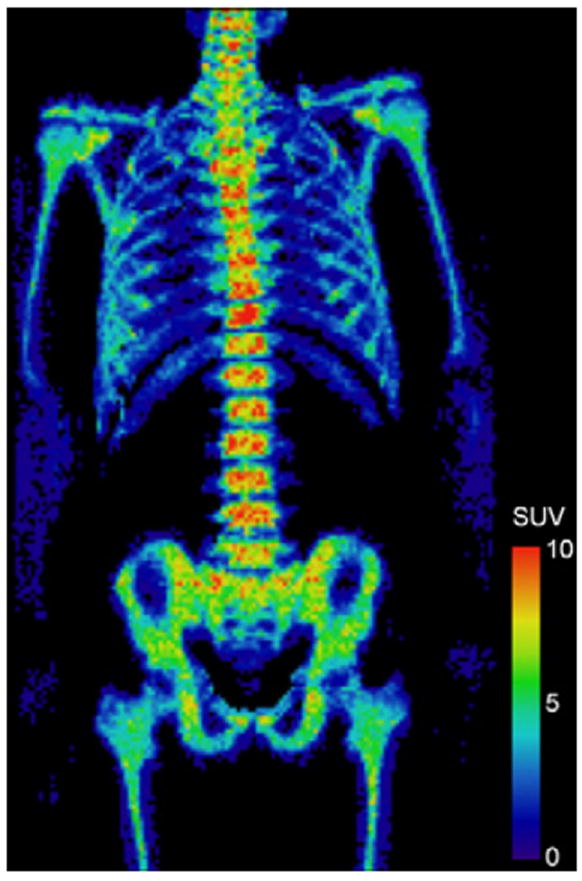
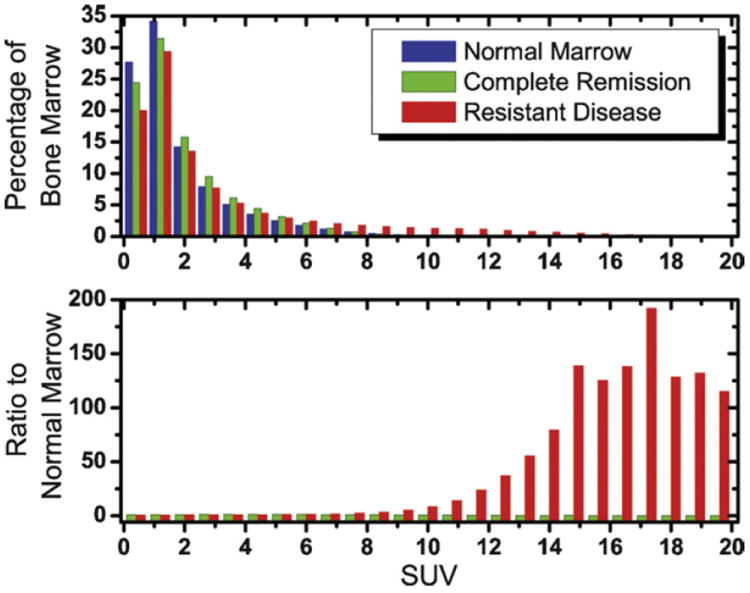
Assessment of treatment response in acute leukemia is routinely performed after therapy via bone marrow biopsy. We investigated the use of positron emission tomography (PET) for early assessment of treatment response in patients with acute myeloid leukemia (AML), using the proliferation marker 3'-deoxy-3'-[(18)F]fluoro-l-thymidine (FLT). Eight adult AML patients receiving induction chemotherapy underwent whole-body FLT PET/CT scans acquired at different time points during therapy. Patients who entered complete remission (CR) exhibited significantly lower FLT uptake in bone marrow than those patients with resistant disease (RD). In bone marrow, mean and maximum standardized uptake values were 0.8, 3.6 for CR and 1.6, 11.4 for RD, p<0.001. FLT PET results for CR and RD patients were independent of assessment time point, suggesting that FLT PET scans acquired as early as 2 days after chemotherapy initiation may be predictive of clinical response. This pilot study suggests that FLT PET imaging during induction chemotherapy may serve as an early biomarker of treatment response in AML.
Copyright © 2010 Elsevier Ltd. All rights reserved.
Conflict of interest statement
There are no conflicts of interest and no financial disclosures from any authors.
Figures
References
-
- DeVita VT, Hellman S, Rosenberg SA. Cancer, principles & practice of oncology. Philadelphia, PA: Lippincott Williams & Wilkins; 2005.
-
- Cheson BD, Bennett JM, Kopecky KJ, et al. Revised recommendations of the international working group for diagnosis, standardization of response criteria, treatment outcomes, and reporting standards for therapeutic trials in acute myeloid leukemia. J Clin Oncol. 2003;21:4642–9. - PubMed
-
- Hiddemann W, Clarkson BD, Buchner T, et al. Bone marrow cell count per cubic millimeter bone marrow: a new parameter for quantitating therapy-induced cytoreduction in acute leukemia. Blood. 1982;59:216–25. - PubMed
-
- Buck AK, Kratochwil C, Glatting G, et al. Early assessment of therapy response in malignant lymphoma with the thymidine analogue [18F]FLT. Eur J Nucl Med Mol Imaging. 2007;34:1775–82. - PubMed
-
- Pio BS, Park CK, Pietras R, et al. Usefulness of 3′-[F-18]fluoro-3′-deoxythymidine with positron emission tomography in predicting breast cancer response to therapy. Mol Imaging Biol. 2006;8:36–42. - PubMed
Publication types
MeSH terms
Substances
Grants and funding
LinkOut - more resources
Full Text Sources
Other Literature Sources
Medical
Miscellaneous
