

Mapping of numerous disease-associated expression polymorphisms in primary peripheral blood CD4+ lymphocytes
- PMID: 20833654
- PMCID: PMC2972694
- DOI: 10.1093/hmg/ddq392
Mapping of numerous disease-associated expression polymorphisms in primary peripheral blood CD4+ lymphocytes
Abstract
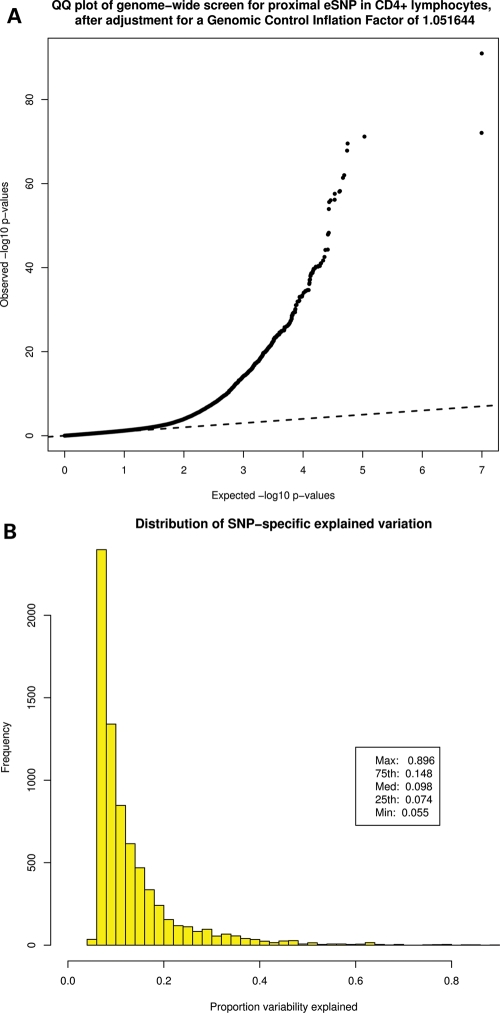
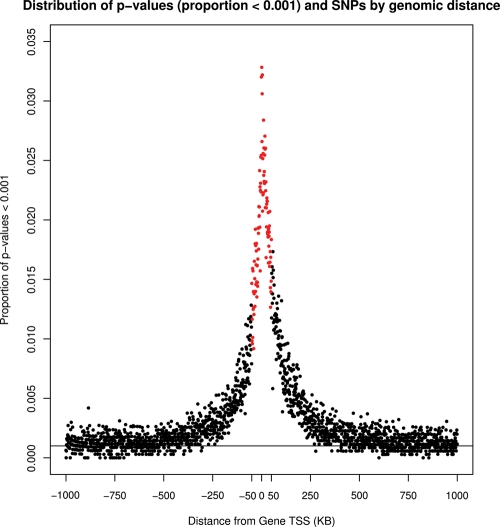
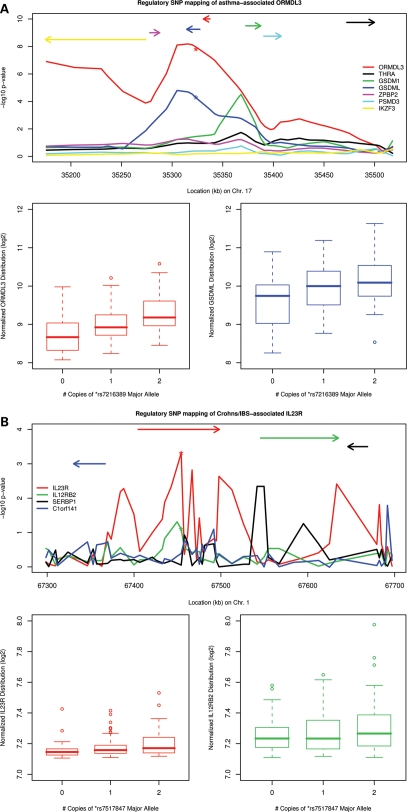
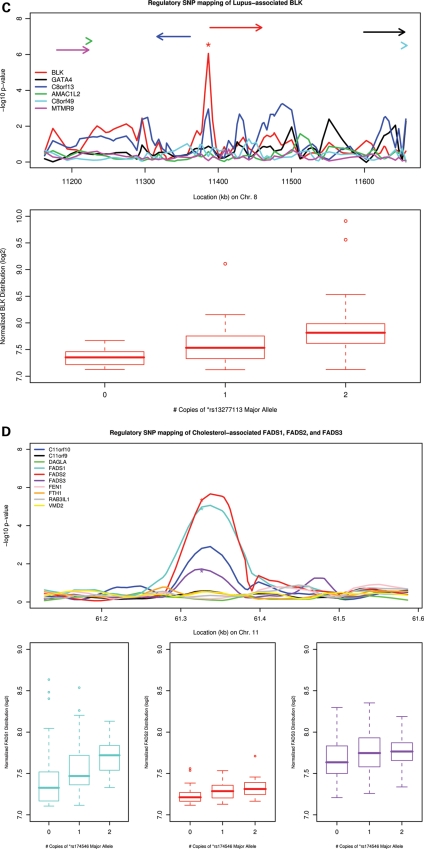
Genome-wide association studies of human gene expression promise to identify functional regulatory genetic variation that contributes to phenotypic diversity. However, it is unclear how useful this approach will be for the identification of disease-susceptibility variants. We generated gene expression profiles for 22 184 mRNA transcripts using RNA derived from peripheral blood CD4+ lymphocytes, and genome-wide genotype data for 516 512 autosomal markers in 200 subjects. We screened for cis-acting variants by testing variants mapping within 50 kb of expressed transcripts for association with transcript abundance using generalized linear models. Significant associations were identified for 1585 genes at a false discovery rate of 0.05 (corresponding to P-values ranging from 1 × 10(-91) to 7 × 10(-4)). Importantly, we identified evidence of regulatory variation for 119 previously mapped disease genes, including 24 examples where the variant with the strongest evidence of disease-association demonstrates strong association with specific transcript abundance. The prevalence of cis-acting variants among disease-associated genes was 63% higher than the genome-wide rate in our data set (P = 6.41 × 10(-6)), and although many of the implicated loci were associated with immune-related diseases (including asthma, connective tissue disorders and inflammatory bowel disease), associations with genes implicated in non-immune-related diseases including lipid profiles, anthropomorphic measurements, cancer and neurologic disease were also observed. Genetic variants that confer inter-individual differences in gene expression represent an important subset of variants that contribute to disease susceptibility. Population-based integrative genetic approaches can help identify such variation and enhance our understanding of the genetic basis of complex traits.
Figures
References
-
- Hindorff L.A., Sethupathy P., Junkins H.A., Ramos E.M., Mehta J.P., Collins F.S., Manolio T.A. Potential etiologic and functional implications of genome-wide association loci for human diseases and traits. Proc. Natl Acad. Sci. USA. 2009;106:9362–9367. doi:10.1073/pnas.0903103106. - DOI - PMC - PubMed
-
- Hakonarson H., Qu H.Q., Bradfield J.P., Marchand L., Kim C.E., Glessner J.T., Grabs R., Casalunovo T., Taback S.P., Frackelton E.C., et al. A novel susceptibility locus for type 1 diabetes on Chr12q13 identified by a genome-wide association study. Diabetes. 2008;57:1143–1146. doi:10.2337/db07-1305. - DOI - PubMed
-
- Jansen R.C., Nap J.P. Genetical genomics: the added value from segregation. Trends Genet. 2001;17:388–391. doi:10.1016/S0168-9525(01)02310-1. - DOI - PubMed
-
- Jais P.H. How frequent is altered gene expression among susceptibility genes to human complex disorders? Genet. Med. 2005;7:83–96. doi:10.1097/01.GIM.0000153665.55420.C3. - DOI - PubMed
-
- Cheung V.G., Conlin L.K., Weber T.M., Arcaro M., Jen K.Y., Morley M., Spielman R.S. Natural variation in human gene expression assessed in lymphoblastoid cells. Nat. Genet. 2003;33:422–425. doi:10.1038/ng1094. - DOI - PubMed
Publication types
MeSH terms
Substances
Grants and funding
LinkOut - more resources
Full Text Sources
Molecular Biology Databases
Research Materials
