. 2010 Nov 19;285(47):36447-55.
doi: 10.1074/jbc.M110.144907. Epub 2010 Sep 10.

Structure of dimeric F1F0-ATP synthase

Affiliations

Structure of dimeric F1F0-ATP synthase

Sergio J Couoh-Cardel et al. J Biol Chem. .

Abstract

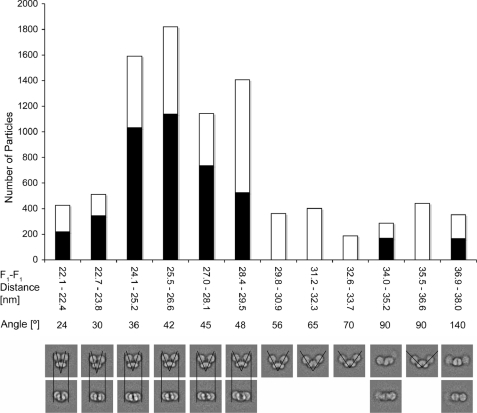
The structure of the dimeric ATP synthase from yeast mitochondria was analyzed by transmission electron microscopy and single particle image analysis. In addition to the previously reported side views of the dimer, top view and intermediate projections served to resolve the arrangement of the rotary c(10) ring and the other stator subunits at the F(0)-F(0) dimeric interface. A three-dimensional reconstruction of the complex was calculated from a data set of 9960 molecular images at a resolution of 27 Å. The structural model of the dimeric ATP synthase shows the two monomers arranged at an angle of ∼45°, consistent with our earlier analysis of the ATP synthase from bovine heart mitochondria (Minauro-Sanmiguel, F., Wilkens, S., and Garcia, J. J. (2005) Proc. Natl. Acad. Sci. U.S.A. 102, 12356-12358). In the ATP synthase dimer, the two peripheral stalks are located near the F(1)-F(1) interface but are turned away from each other so that they are not in contact. Based on the three-dimensional reconstruction, a model of how dimeric ATP synthase assembles to form the higher order oligomeric structures that are required for mitochondrial cristae biogenesis is discussed.


Figures

FIGURE 1.
FIGURE 1.
Purification and transmission electron microscopy of the yeast F1F0-ATP synthase dimer. a, glycerol gradient fractionation of digitonin extracts of yeast mitochondrial inner membranes as analyzed by ATPase activity staining in native polyacrylamide gels. The 1st left lane was loaded with an aliquot of the digitonin mitochondrial extract that was subsequently loaded on the glycerol gradient; this shows the two white bands of the functional dimeric and monomeric forms of the S. cerevisiae ATP synthase. Fractions 1–9 collected after the glycerol gradient were loaded in a BN-PAGE gel run in parallel and are shown in the consecutive lanes as indicated. b, transmission electron microscopy of purified ATP synthase dimer. Fraction 7 of the gradient shown in A was diluted 1:10 in 2 mm MES, pH 7.0, 2 mm EDTA, 2 mm ADP to obtain a final concentration of 0.25 mm digitonin and negatively stained with 1% uranyl acetate on glow discharged carbon coated copper grids. Side and top views of the ATP synthase dimers are marked by circles and rectangles, respectively. c, alignment and classification of a data set of 9960 ATP synthase dimer images. The data set of 9960 images was sorted into 64 or 100 classes, and the averages 1–7 were calculated between 100 and 200 individual projections. For details, see the text.
FIGURE 2.
FIGURE 2.
Analysis of the dimer angles. The data set of 9960 ATP synthase dimer images was sorted into 100 classes, and the F1-F1 distances (edge to edge) and angles between monomers were measured. The white and black bars show the particle numbers of the “side” and “top” views shown at the bottom, respectively. For details, see text.
FIGURE 3.
FIGURE 3.
A and D, top and side view projection of dimeric ATP synthase after multireference alignment and classification. C and F, atomic model of dimeric ATP synthase modeled after the projections shown in A and D. B and E, projections of the atomic model.
FIGURE 4.
FIGURE 4.
Three-dimensional reconstruction of the yeast ATP synthase dimer. A, surface representation of the three-dimensional reconstruction of the yeast ATP synthase dimer. The model was calculated from 123 averages assuming 2-fold symmetry. B, “F1-F1” view of the same model as in A, showing a distance of ∼10 nm between each peripheral stalk and an angle of ∼30° in relation to the diameter perpendicular to the central 2-fold axis of the dimer. C and D, fitting of the atomic reference model into the three-dimensional EM reconstruction. As can be seen, the overall structure fits well with the EM reconstruction except for parts of the peripheral stalks, suggesting some rearrangement of the stator forming polypeptides as a result of the F1-F0 interaction and/or dimer formation. E and F, top and bottom view of the EM reconstruction fitted with the atomic reference model. Chains “s, t, u, and v” correspond to subunits OSCP, b, d, and F6, respectively (53). See text for further details.
FIGURE 5.
FIGURE 5.
Model of the ATP synthase oligomer. A diagonal polymer was built by taking the dimer model shown in Fig. 4A as the building block. The central 2-fold axis of each monomer was moved along a diagonal direction to get a close contact of inter-dimer peripheral stalks. Such an inter-dimer contact of the peripheral stalks would explain the cross-linking data observed for the in vivo oligomer (see text). The proposed arrangement may induce membrane curvature by slight separation of the (F1)2-(F1)2 interfaces, and/or by forming a slight angle of the central 2-fold axes with respect to one another as the polymer opens as a fan to form a helical oligomer that wraps tubular cristae. See text for further details.

References

    1. Mitchell P. (1961) Nature 191, 144–148 - PubMed
    1. Boyer P. D. (1997) Annu. Rev. Biochem. 66, 717–749 - PubMed
    1. Capaldi R. A., Aggeler R. (2002) Trends Biochem. Sci. 27, 154–160 - PubMed
    1. Feniouk B. A., Yoshida M. (2008) Results Probl. Cell Differ. 45, 279–308 - PubMed
    1. Wilkens S. (2005) Adv. Protein Chem. 71, 345–382 - PubMed

Publication types

MeSH terms

Substances