. 2010 Dec 9;116(24):5403-18.
doi: 10.1182/blood-2010-06-289272. Epub 2010 Sep 10.

GVHD after haploidentical transplantation: a novel, MHC-defined rhesus macaque model identifies CD28- CD8+ T cells as a reservoir of breakthrough T-cell proliferation during costimulation blockade and sirolimus-based immunosuppression

Affiliations

GVHD after haploidentical transplantation: a novel, MHC-defined rhesus macaque model identifies CD28- CD8+ T cells as a reservoir of breakthrough T-cell proliferation during costimulation blockade and sirolimus-based immunosuppression

Weston P Miller et al. Blood. .

Abstract

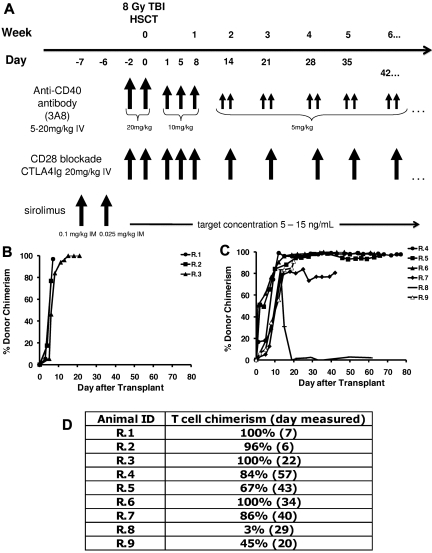
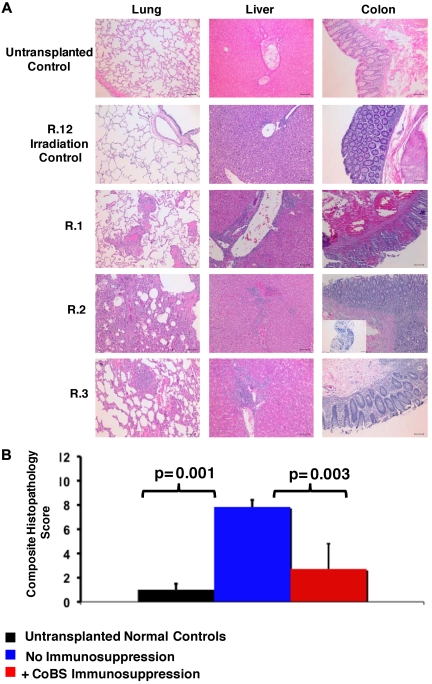
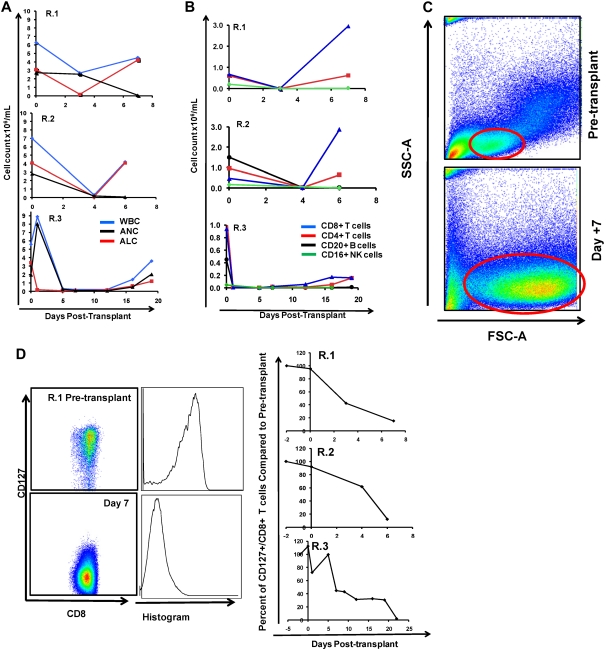
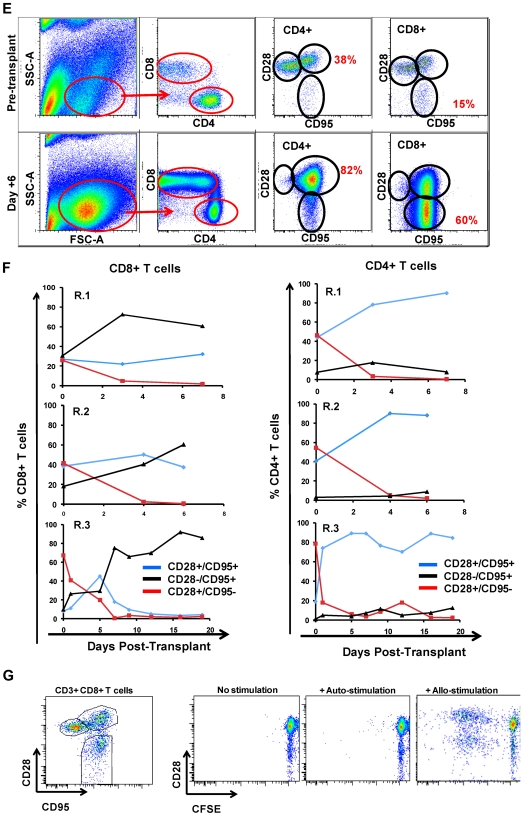
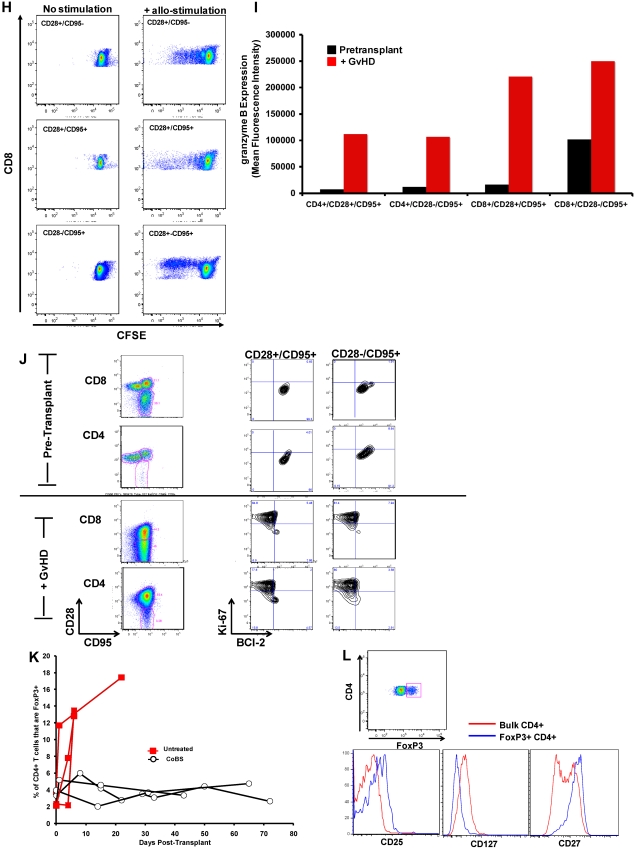
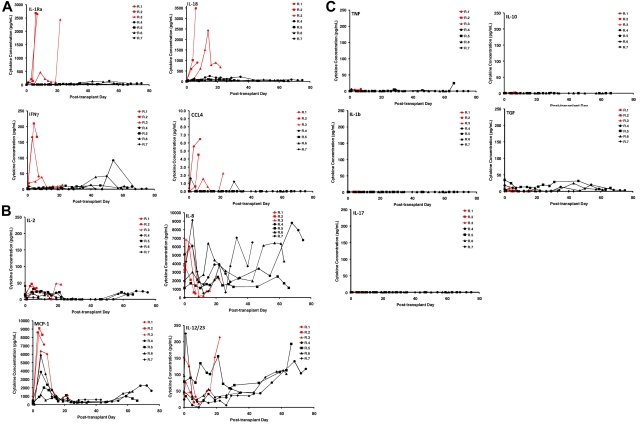
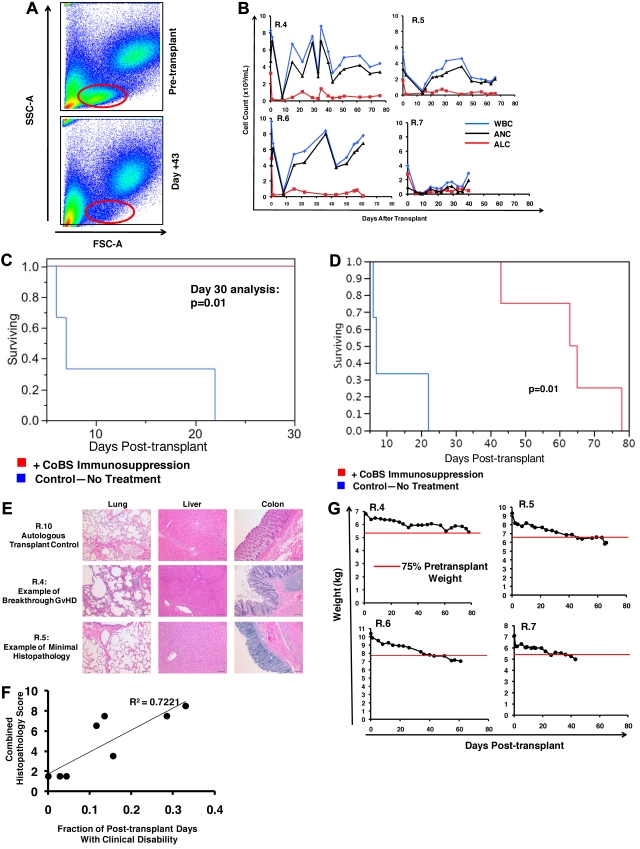
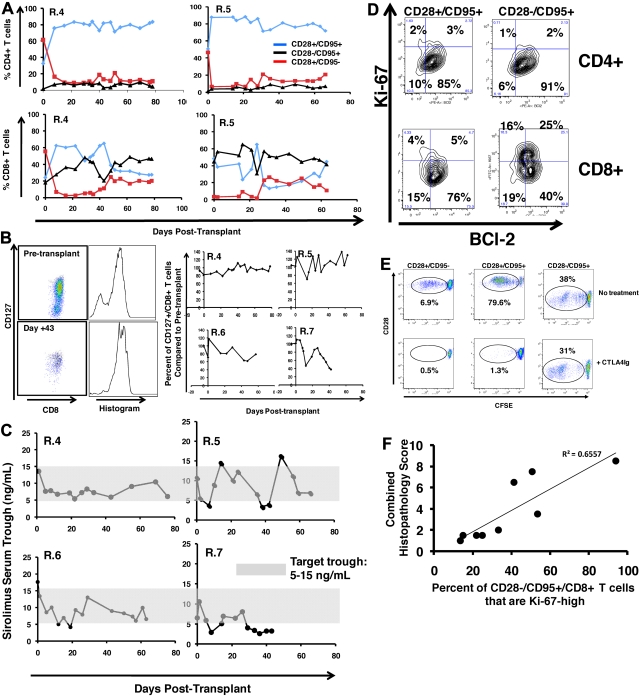
We have developed a major histocompatibility complex-defined primate model of graft-versus-host disease (GVHD) and have determined the effect that CD28/CD40-directed costimulation blockade and sirolimus have on this disease. Severe GVHD developed after haploidentical transplantation without prophylaxis, characterized by rapid clinical decline and widespread T-cell infiltration and organ damage. Mechanistic analysis showed activation and possible counter-regulation, with rapid T-cell expansion and accumulation of CD8(+) and CD4(+) granzyme B(+) effector cells and FoxP3(pos)/CD27(high)/CD25(pos)/CD127(low) CD4(+) T cells. CD8(+) cells down-regulated CD127 and BCl-2 and up-regulated Ki-67, consistent with a highly activated, proliferative profile. A cytokine storm also occurred, with GVHD-specific secretion of interleukin-1 receptor antagonist (IL-1Ra), IL-18, and CCL4. Costimulation Blockade and Sirolimus (CoBS) resulted in striking protection against GVHD. At the 30-day primary endpoint, CoBS-treated recipients showed 100% survival compared with no survival in untreated recipients. CoBS treatment resulted in survival, increasing from 11.6 to 62 days (P < .01) with blunting of T-cell expansion and activation. Some CoBS-treated animals did eventually develop GVHD, with both clinical and histopathologic evidence of smoldering disease. The reservoir of CoBS-resistant breakthrough immune activation included secretion of interferon-γ, IL-2, monocyte chemotactic protein-1, and IL-12/IL-23 and proliferation of cytotoxic T-lymphocyte-associated antigen 4 immunoglobulin-resistant CD28(-) CD8(+) T cells, suggesting adjuvant treatments targeting this subpopulation will be needed for full disease control.


Figures

Figure 1
Figure 1
High-level chimerism after rhesus HSCT. (A) Rhesus macaque HSCT strategy. Each component of CoBS immunosuppression (anti-CD40 monoclonal antibody, CTLA4Ig, sirolimus) is shown, along with the total body irradiation (TBI)–based conditioning regimen. Control animals received only TBI-based conditioning but no posttransplantation immunosuppression. (B) Whole-blood chimerism in recipients who did not receive posttransplantation immunosuppression (R.1-R.3). (C) Whole-blood chimerism in recipients who received CoBS (R.4-9). (D) T-cell chimerism in the transplant recipients.
Figure 2
Figure 2
Histopathologic evidence of GVHD in animals that received a transplant and no immunosuppression (R.1-R.3). (A) Photomicrographs of hematoxylin and eosin (H&E) staining of the lungs, liver, and colon show GVHD in untreated animals. These studies used an Olympus BX51 microscope (Olympus America), using a 10×/0.40 UPlan Apo lens (Olympus). Slides were mounted with Permount solution (Sigma-Aldrich) and photographs were taken with the Spot RT Slider imaging system (Spot Imaging Solutions). Image analysis was performed using Spot Advanced Version 4.6 (Spot Imaging Solutions), and image processing was performed using Photoshop CS4 extended v11.01 (Adobe). (Row 1) A normal control that did not receive a transplant; (row 2) R.12, an irradiation control; (row 3) R.1; (row 4) R.2 (inset in the colon photomicrograph shows an example of CD3 staining of this organ); (row 5) R.3. Bar = 100 μm. (B) Untreated transplant recipients demonstrated significantly higher GVHD histopathology scores compared with either normal controls or CoBS-treated transplant recipients. Combined histopathologic GVHD scores for controls that did not receive a transplant (black), recipients of transplants without immunosuppression (blue), and recipients receiving CoBS immunosuppression (red) are shown. The histopathologic GVHD grading was performed by a pathologist blinded to the treatment regimens that the animals received. Individual tissue scores were from 0 (no GVHD) to 4 (severe GVHD), and the combined score was the sum of individual scores from the lung, liver, and colon.
Figure 3
Figure 3
The flow cytometric signature of primate GVHD. (A) Longitudinal analysis of the white blood cell (WBC) count, absolute neutrophil count (ANC), and absolute lymphocyte count (ALC) in R.1-R.3. (B) Longitudinal analysis of the absolute CD8+ T-cell count, the absolute CD4+ T-cell count, the absolute CD20+ B-cell count, and the absolute CD16+ natural killer (NK) cell count in R.1-R.3. (C) Forward-scatter (FSC-A) versus side-scatter (SSC-A) flow cytometric analysis of the lymphocyte blast phenotype (red circle) in GVHD. Example from R.1 before transplantation (top) and on day 7 (bottom), during rapid T-cell expansion. (D) Down-regulation of CD127 in expanding CD8+ T cells during GVHD. Panels on the left show pseudocolor dot plots and histogram analysis of CD127 expression on CD8+ T cells analyzed both before transplantation (top) and on day 7 (bottom). Panels on the right show longitudinal analysis of CD127 expression on CD8+ T cells in R.1-R.3, compared with pretransplantation expression levels of CD127. (E) Representative flow cytometric analysis of R.2, showing the phenotypic shift away from naive T cells that occurred in both CD4+ and CD8+ compartments during GVHD; before transplantation (top), day 6 after transplantation (bottom). (Third column from the left, top, and bottom) Example of CD4+ T cells shifting to a CD28+/CD95+ predominant phenotype after transplantation (compare top with bottom rows). (Fourth column from the left) Example of CD8+ T cells shifting to a CD28/CD95+ predominant phenotype after transplantation (compare top with bottom rows). (F) Longitudinal analysis of CD4+ and CD8+ T-cell subsets during GVHD. R.1-R.3 all shift toward a predominant CD28/CD95+ CD8+ phenotype (left) and a predominant CD28+/CD95+ CD4+ phenotype (right). (G) Representative CFSE (5,6-carboxyfluorescein diacetate, succinimidyl ester) MLR analysis of the proliferation of CD28+ and CD28 CD8+ T cells. (Left) Representative flow cytometric analysis of CD3+/CD8+ T cells showing the CD28 and CD95 phenotypes. (Right) CFSE MLR analysis after a 5-day MLR culture. Minimal proliferation occurred in cultures incubated without any stimulators (“No stimulation”) or those incubated with autologous stimulator cells (“+ Auto-stimulation”). However, in those incubated with allogeneic PBMCs (“+ Allo-stimulation), proliferation occurred in both CD28+ and CD28 subpopulations. The results shown are representative of ≥ 5 separate MLR assays with the use of distinct donor:recipient pairs. (H) CFSE MLR analysis of flow cytometrically sorted CD28+ and CD28 populations. CD28+/CD95, CD28+/CD95+, and CD28/CD95+ CD8+ T cells were sorted with a FACSAria flow cytometer before CFSE MLR analysis either in the absence (left) or presence (right) of allogeneic stimulator cells. Shown are representative CFSE proliferation profiles from 1 of 3 replicate experiments. (I) Granzyme B expression is highly up-regulated during GVHD. Shown is a representative example of the mean fluorescence intensity of granzyme B in both CD28+/CD95+ and CD28/CD95+ subpopulations for CD4+ and CD8+ T cells; granzyme B fluorescence before transplantation (black), granzyme B fluorescence at the time of necropsy in the setting of severe clinical GVHD (red). (J) BCl-2 and Ki-67 show significant shifts in expression during GVHD. (Top) Representative analysis from R.2, before transplantation. (Bottom) Day 6 after transplantation. (Left) T-cell subpopulations are first identified with CD28 and CD95 staining. The CD28+/CD95+ and CD28/CD95+ cells were then queried for their expression of BCl-2 and Ki-67 (right). (K) CD4+/FoxP3+ cells expanded during GVHD in rhesus macaques. (Red) Longitudinal analysis of CD4+/FoxP3+ T-cell homeostasis in the untreated animals R.2, R.3, as well as a third MHC-disparate transplant recipient (R.1 could not be evaluated because of a technical problem with FoxP3 staining on the day of death). (Black) Longitudinal analysis of CD4+/FoxP3+ T-cell homeostasis in the CoBS-treated animals, R.4, R.5, and R.7 (R.6 could not be evaluated because of technical problems with CD3/CD4 staining for this animal). (L) FoxP3+/CD4+ T cells (gated population, and blue traces on the histograms) showed up-regulation of CD25, down-regulation of CD127, and up-regulation of CD27 compared with FoxP3/CD4+ T cells (red traces).
Figure 3
Figure 3
The flow cytometric signature of primate GVHD. (A) Longitudinal analysis of the white blood cell (WBC) count, absolute neutrophil count (ANC), and absolute lymphocyte count (ALC) in R.1-R.3. (B) Longitudinal analysis of the absolute CD8+ T-cell count, the absolute CD4+ T-cell count, the absolute CD20+ B-cell count, and the absolute CD16+ natural killer (NK) cell count in R.1-R.3. (C) Forward-scatter (FSC-A) versus side-scatter (SSC-A) flow cytometric analysis of the lymphocyte blast phenotype (red circle) in GVHD. Example from R.1 before transplantation (top) and on day 7 (bottom), during rapid T-cell expansion. (D) Down-regulation of CD127 in expanding CD8+ T cells during GVHD. Panels on the left show pseudocolor dot plots and histogram analysis of CD127 expression on CD8+ T cells analyzed both before transplantation (top) and on day 7 (bottom). Panels on the right show longitudinal analysis of CD127 expression on CD8+ T cells in R.1-R.3, compared with pretransplantation expression levels of CD127. (E) Representative flow cytometric analysis of R.2, showing the phenotypic shift away from naive T cells that occurred in both CD4+ and CD8+ compartments during GVHD; before transplantation (top), day 6 after transplantation (bottom). (Third column from the left, top, and bottom) Example of CD4+ T cells shifting to a CD28+/CD95+ predominant phenotype after transplantation (compare top with bottom rows). (Fourth column from the left) Example of CD8+ T cells shifting to a CD28/CD95+ predominant phenotype after transplantation (compare top with bottom rows). (F) Longitudinal analysis of CD4+ and CD8+ T-cell subsets during GVHD. R.1-R.3 all shift toward a predominant CD28/CD95+ CD8+ phenotype (left) and a predominant CD28+/CD95+ CD4+ phenotype (right). (G) Representative CFSE (5,6-carboxyfluorescein diacetate, succinimidyl ester) MLR analysis of the proliferation of CD28+ and CD28 CD8+ T cells. (Left) Representative flow cytometric analysis of CD3+/CD8+ T cells showing the CD28 and CD95 phenotypes. (Right) CFSE MLR analysis after a 5-day MLR culture. Minimal proliferation occurred in cultures incubated without any stimulators (“No stimulation”) or those incubated with autologous stimulator cells (“+ Auto-stimulation”). However, in those incubated with allogeneic PBMCs (“+ Allo-stimulation), proliferation occurred in both CD28+ and CD28 subpopulations. The results shown are representative of ≥ 5 separate MLR assays with the use of distinct donor:recipient pairs. (H) CFSE MLR analysis of flow cytometrically sorted CD28+ and CD28 populations. CD28+/CD95, CD28+/CD95+, and CD28/CD95+ CD8+ T cells were sorted with a FACSAria flow cytometer before CFSE MLR analysis either in the absence (left) or presence (right) of allogeneic stimulator cells. Shown are representative CFSE proliferation profiles from 1 of 3 replicate experiments. (I) Granzyme B expression is highly up-regulated during GVHD. Shown is a representative example of the mean fluorescence intensity of granzyme B in both CD28+/CD95+ and CD28/CD95+ subpopulations for CD4+ and CD8+ T cells; granzyme B fluorescence before transplantation (black), granzyme B fluorescence at the time of necropsy in the setting of severe clinical GVHD (red). (J) BCl-2 and Ki-67 show significant shifts in expression during GVHD. (Top) Representative analysis from R.2, before transplantation. (Bottom) Day 6 after transplantation. (Left) T-cell subpopulations are first identified with CD28 and CD95 staining. The CD28+/CD95+ and CD28/CD95+ cells were then queried for their expression of BCl-2 and Ki-67 (right). (K) CD4+/FoxP3+ cells expanded during GVHD in rhesus macaques. (Red) Longitudinal analysis of CD4+/FoxP3+ T-cell homeostasis in the untreated animals R.2, R.3, as well as a third MHC-disparate transplant recipient (R.1 could not be evaluated because of a technical problem with FoxP3 staining on the day of death). (Black) Longitudinal analysis of CD4+/FoxP3+ T-cell homeostasis in the CoBS-treated animals, R.4, R.5, and R.7 (R.6 could not be evaluated because of technical problems with CD3/CD4 staining for this animal). (L) FoxP3+/CD4+ T cells (gated population, and blue traces on the histograms) showed up-regulation of CD25, down-regulation of CD127, and up-regulation of CD27 compared with FoxP3/CD4+ T cells (red traces).
Figure 4
Figure 4
Multiplexed luminex analysis shows a GVHD-specific cytokine secretion profile. (A) Secretion patterns of IL-1RA, IL-18, IFNγ, and CCL4 in both untreated (red traces) and CoBS-treated (black traces) transplant recipients. (B) Secretion patterns of IL-2, IL-8, monocyte chemotactic protein 1 (MCP-1), and IL-12/23 in both untreated (red traces) and CoBS-treated (black traces) transplant recipients. (C) Secretion patterns of tumor necrosis factor, IL-10, IL-1β, transforming growth factor (TGF), and IL-17 in both untreated (red traces) and CoBS-treated (black traces) transplant recipients.
Figure 5
Figure 5
The effect of CoBS immunosuppression on GVHD. (A) Lymphocyte proliferation was inhibited in animals treated with CoBS. Representative example of R.5 showing forward-scatter versus side-scatter characteristics before transplantation (top) and on day 43 (bottom), during CoBS treatment. (B) Longitudinal analysis of the white blood cell (WBC) count, absolute neutrophil count (ANC) and absolute lymphocyte count (ALC) in R.4-R.7. (C) Survival advantage observed with CoBS immunosuppression. At the 30-day primary endpoint, all untreated animals had died, and 100% of CoBS-treated animals survived (P = .01). (D) Extended survival analysis of CoBS-treated versus untreated cohorts. Log-rank analysis indicated that overall survival of the CoBS-treated cohort (MST = 62 days) was statistically significantly different from the untreated cohort (MST = 11.6 days; P = .01). MST = mean survival time. (E) Photomicrographs of hematoxylin and eosin staining of the lungs, liver, and colon of the autologous transplant control (R.10), a representative CoBS-treated recipient who developed significant breakthrough GVHD (R.4), and a representative CoBS-treated recipient who showed minimal GVHD histopathology (R.5). Bar = 100 μm. These studies used an Olympus BX51 microscope (Olympus America), using a 10×/0.40 UPlan Apo lens (Olympus). Slides were mounted with Permount solution (Sigma-Aldrich) and photographs were taken with the Spot RT Slider imaging system (Spot Imaging Solutions). Image analysis was performed using Spot Advanced Version 4.6 (Spot Imaging Solutions), and image processing was performed using Photoshop CS4 extended v11.01 (Adobe). (F) Correlation of clinical disability (as measured by the activity score) with GVHD histopathology. The data fit a linear equation with an R2 = 0.7221. (G) Longitudinal analysis of weight loss in animals treated with CoBS immunosuppression.
Figure 6
Figure 6
Flow cytometric analysis of CoBS-treated transplant recipients. (A) Longitudinal analysis of representative CD4+ (top) and CD8+ (bottom) T-cell subsets during CoBS treatment (R.4 and R.5 are shown). (B) CD127 expression on CD8+ T cells in CoBS-treated animals. (Left) Pseudocolor dot plots and histogram analysis are representative of CD127 expression on CD8+ T cells from R.5 analyzed both before transplantation (top) and on day 43 after transplantation (bottom). (Right) Longitudinal analysis is shown of CD127 expression on CD8+ T cells in R.4-R.7 normalized for pretransplantation expression levels of CD127. (C) Sirolimus levels measured longitudinally in animals R.4-R.7. The shaded area is the target trough range: 5-15 ng/mL. (D) BCl-2 and Ki-67 on CD4+ and CD8+ CD28+/CD95+ and CD28/CD95+ T cells in a representative CoBS-treated animal (R.4). (E) CTLA4Ig-resistant alloproliferation of CD28 T cells as measured by CFSE (5,6-carboxyfluorescein diacetate, succinimidyl ester) MLR. (Top) Representative dot plots showing T-cell alloproliferation in CD28+/CD95, CD28+/CD95+, and CD28/CD95+ T-cell populations in the absence of CTA4Ig treatment. (Bottom) Representative dot plots showing T-cell alloproliferation in CD28+/CD95, CD28+/CD95+, and CD28-CD95+ T-cell populations in the presence of 1.6μM CTLA4Ig, showing CTLA4Ig-resistant alloproliferation existing in the CD28/CD95+ subpopulation. A dose-response curve of 0.8-12.8μM CTLA4Ig was performed (not shown), with similar results observed for all concentrations of CTLA4Ig tested. For each population, the percentage of cells that had undergone ≥ 1 cell division was measured with FlowJo flow cytometry analysis software (Tree Star) and is noted on the corresponding dot plots. (F) Correlation of the percentage of Ki-67high CD28/CD95+ CD8+ T cells with GVHD histopathology scores. The maximal percentage of CD28/CD95+/CD8+ cells that up-regulated Ki-67 was compared with the total histopathology score (Table 4). The data fit a linear equation with an R2 = 0.6557.

References

    1. Cruzado JM, Bestard O, Grinyo JM. New immunosuppressive protocols with the advent of novel biological drugs. Transplantation. 2009;88(3 suppl):S20–S23. - PubMed
    1. Adams AB, Durham MM, Kean L, et al. Costimulation blockade, busulfan, and bone marrow promote titratable macrochimerism, induce transplantation tolerance, and correct genetic hemoglobinopathies with minimal myelosuppression. J Immunol. 2001;167(2):1103–1111. - PubMed
    1. Aoyagi T, Yamashita K, Suzuki T, et al. A human anti-CD40 monoclonal antibody, 4D11, for kidney transplantation in cynomolgus monkeys: induction and maintenance therapy. Am J Transplant. 2009;9(8):1732–1741. - PubMed
    1. Bluestone JA, St Clair EW, Turka LA. CTLA4Ig: bridging the basic immunology with clinical application. Immunity. 2006;24(3):233–238. - PubMed
    1. Gilson CR, Milas Z, Gangappa S, et al. Anti-CD40 monoclonal antibody synergizes with CTLA4Ig in promoting long-term graft survival in murine models of transplantation. J Immunol. 2009;183(3):1625–1635. - PMC - PubMed

Publication types

MeSH terms