. 2010 Oct 20;29(20):3484-95.
doi: 10.1038/emboj.2010.224. Epub 2010 Sep 10.

Differences in signalling by directly and indirectly binding ligands in bacterial chemotaxis

Affiliations

Differences in signalling by directly and indirectly binding ligands in bacterial chemotaxis

Silke Neumann et al. EMBO J. .

Abstract

In chemotaxis of Escherichia coli and other bacteria, extracellular stimuli are perceived by transmembrane receptors that bind their ligands either directly, or indirectly through periplasmic-binding proteins (BPs). As BPs are also involved in ligand uptake, they provide a link between chemotaxis and nutrient utilization by cells. However, signalling by indirectly binding ligands remains much less understood than signalling by directly binding ligands. Here, we compared intracellular responses mediated by both types of ligands and developed a new mathematical model for signalling by indirectly binding ligands. We show that indirect binding allows cells to better control sensitivity to specific ligands in response to their nutrient environment and to coordinate chemotaxis with ligand transport, but at the cost of the dynamic range being much narrower than for directly binding ligands. We further demonstrate that signal integration by the chemosensory complexes does not depend on the type of ligand. Overall, our data suggest that the distinction between signalling by directly and indirectly binding ligands is more physiologically important than the traditional distinction between high- and low-abundance receptors.


Conflict of interest statement

The authors declare that they have no conflict of interest.

Figures

Figure 1
Figure 1
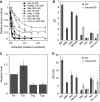
Response of major and minor receptors to attractants. Dose responses of wild-type cells to ligands of major (A) and minor receptors (B). Cells were stimulated by step-like addition of increasing amounts of attractant. The following abbreviations are used here and throughout: Asp, L-aspartate; MeAsp, α-methyl-DL-aspartate; Ser, L-serine; AiBu, α-aminoisobutyrate; Mal, maltose; Gal, galactose; Rib, ribose; Pro-Leu, proline-leucine dipeptide. Resulting initial changes in kinase activity were measured using a FRET activity reporter (see main text and Materials and methods). After each stimulation, the cells were re-adapted to buffer. The response for each step was normalized to the response of buffer-adapted cells towards a saturating stimulus of 100 μM MeAsp. (C) Threshold sensitivity ST, determined as EC50−1 from Hill fits to the dose-response curves of individual experiments. Error bars indicate standard errors.
Figure 2
Figure 2
Dynamic range and adaptation precision. Dynamic range (A, B) and adaptation precision (C, D) for major (A, C) and minor (B, D) receptors. For dynamic range measurements, concentrations were raised in three-fold steps, and the cells were allowed to adapt prior to each subsequent stimulation. The response for each step was calculated relative to the response towards a saturating stimulus (100 μM MeAsp for buffer-adapted cells) and is plotted against the final concentration of ligand. Precision of adaptation was defined as the adapted FRET value in the presence of a given concentration of ambient ligand, normalized to the adapted value of FRET in buffer. In these experiments, duration of adaptation was limited to 45 min. Error bars indicate standard errors.
Figure 3
Figure 3
Response sensitivity of major and minor receptors. (A) Dose-response curves for cells that were pre-adapted to an ambient concentration of the respective ligand around the peak of the dynamic range (shown in brackets). Kinase activity is plotted as a function of final ligand concentration, normalized to the respective ambient concentration. (B) Response sensitivity at the peak of the dynamic range, SRP, for WT and otherwise wild-type cells each expressing a plasmid-encoded periplasmic binding protein (BP) at maximum induction of 10 μM salicylate. See text for the definition of SRP. (C) Native expression levels of receptors in wild-type cells normalized to Tsr, determined by immunoblot as described in Materials and methods and in Supplementary Figure S4. (D) SRP values from (B) normalized to the receptor fraction. Error bars indicate standard errors.
Figure 4
Figure 4
Dependence of chemotactic response on binding protein (BP) and receptor expression. (A) Response amplitudes to saturating stimuli of dipeptide Pro-Leu at varying levels of DppA or to galactose at varying levels of MglB. (B) Threshold sensitivity ST of the response to the dipeptide Pro-Leu at varying levels of DppA or to galactose at varying levels of MglB. Arrows mark the native BP expression level estimated from ST of wild-type cells. (A, B) Dipeptide BP DppA was expressed at different levels of salicylate induction in a ΔdppA strain, and the galactose BP MglB was expressed in a ΔmglB strain. Expression of BPs was assumed to be proportional to the expression of yellow fluorescent protein (YFP) from the same promoter, measured by FACS and used for the X axis. The data were fitted using the function ST=STmax[BP]/(C+[BP]), where C is a constant (see equation (3)). (C) Dynamic range of the response to galactose at varying expression of MglB. The three highest expression levels in the ΔmglB background from (A) are shown, with darker grey levels corresponding to higher expression. The wild-type dynamic range is shown for comparison. Data were fitted using the function SR=C1C2[L]/((C2+[L])([L]+C3)), where C1, C2, and C3 are constants (see equation S18 in Supplementary data). (D) Threshold sensitivity of the response to MeAsp at varying levels of Tar or to galactose at varying levels of Trg. Tar was expressed at different levels of salicylate induction in a Δtar strain; Trg was expressed in the wild-type strain. Receptor expression levels were determined as in Figure 3C and normalized to the native expression of Tsr. Data were fitted using the function ST=STmax[R]/([R]+C), where C is a constant describing the expression level of all other receptors. Response amplitudes were nearly saturating at all measured expression levels. Arrows mark the native expression levels of Trg and Tar. Error bars indicate standard errors.
Figure 5
Figure 5
Collapse of receptor activity when plotted as a function of free-energy change. Results are shown for wild-type cells responding to indicated ligands. Binding parameters were obtained through the collapse of normalized dose-response and dynamic-range curves of both wild-type cells and cells at different BP induction levels. The free-energy model for BP-binding ligands (Approximation 1) and binding parameters are described in Supplementary data. The observed ratios Tar: Tsr: Tap: Trg of 1.5:1:0.5:0.5 were used for the collapse.
Figure 6
Figure 6
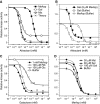
Responses to simultaneous stimulation with multiple ligands. (A, B) Signal integration. (A) Integration of stimuli of the same sign. Dose responses were acquired for buffer-adapted cells to MeAsp and galactose separately, and then to simultaneous addition of the both MeAsp and galactose at concentrations found to be equipotent from the single-attractant dose-response curves. Responses to the galactose–MeAsp mixture are plotted against galactose concentration. Crosses and dashed line indicate model prediction for the response to the galactose–MeAsp mixture assuming summation of the free energies of ligand binding to the mixed signalling teams. Lines here and throughout are Hill fits to the data. (B) Integration of stimuli of opposing signs. Cells were pre-adapted to 8 μM MeAsp and then stimulated by indicated concentrations of galactose in the buffer. The solid horizontal line indicates the adapted kinase activity at 8 μM MeAsp. No response was observed upon stimulation with the galactose concentration equipotent to 8 μM MeAsp. Below this concentration, the response was negative (increase in kinase activity), whereas above this concentration, the response was positive (decrease in kinase activity). Responses of buffer-adapted cells to galactose and to MeAsp are shown for a reference. A slight difference in the amplitude of the saturated response for galactose in (A, B) is presumably due to variance in the native expression level of GBP. (C, D) Effects of adaptation to other ligands on dose responses. (C) Responses to galactose of cells adapted to buffer, 1 mM MeAsp, 100 μM ribose, or 100 μM glucose. (D) Responses to MeAsp of cells adapted to buffer, 100 μM galactose, 30 μM serine, or 30 μM maltose.

Comment in

Similar articles

Cited by

References

    1. Adler J, Epstein W (1974) Phosphotransferase-system enzymes as chemoreceptors for certain sugars in Escherichia coli chemotaxis. Proc Natl Acad Sci USA 71: 2895–2899 - PMC - PubMed
    1. Adler J, Hazelbauer GL, Dahl MM (1973) Chemotaxis toward sugars in Escherichia coli. J Bacteriol 115: 824–847 - PMC - PubMed
    1. Adler J, Tso WW (1974) ‘Decision'-making in bacteria: chemotactic response of Escherichia coli to conflicting stimuli. Science 184: 1292–1294 - PubMed
    1. Ames P, Studdert CA, Reiser RH, Parkinson JS (2002) Collaborative signalling by mixed chemoreceptor teams in Escherichia coli. Proc Natl Acad Sci USA 99: 7060–7065 - PMC - PubMed
    1. Anraku Y (1968) Transport of sugars and amino acids in bacteria. I. Purification and specificity of the galactose- and leucine-binding proteins. J Biol Chem 243: 3116–3122 - PubMed

Publication types

MeSH terms

LinkOut - more resources