. 2010 Oct;16(10):1128-33.
doi: 10.1038/nm.2201. Epub 2010 Sep 12.

Oral tolerance to food-induced systemic anaphylaxis mediated by the C-type lectin SIGNR1

Affiliations

Oral tolerance to food-induced systemic anaphylaxis mediated by the C-type lectin SIGNR1

Yufeng Zhou et al. Nat Med. 2010 Oct.

Abstract

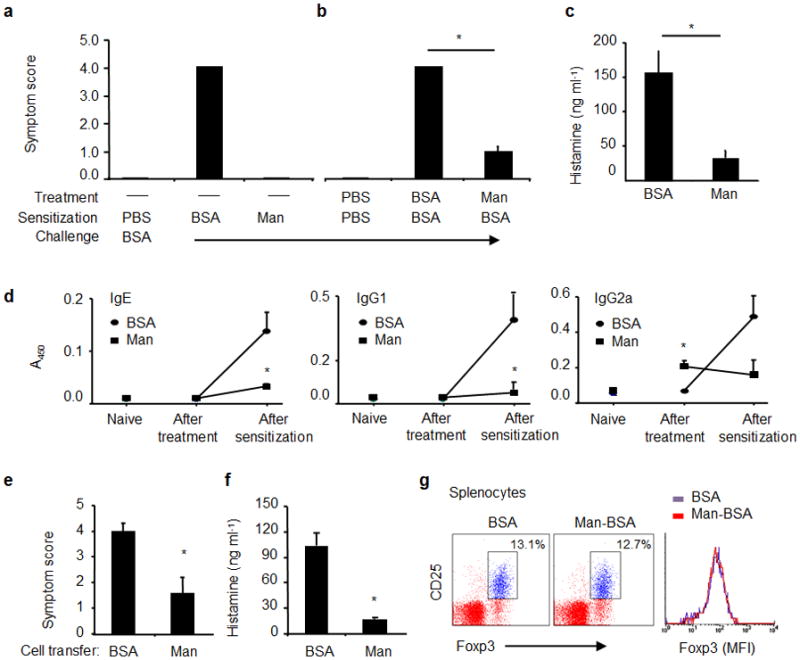
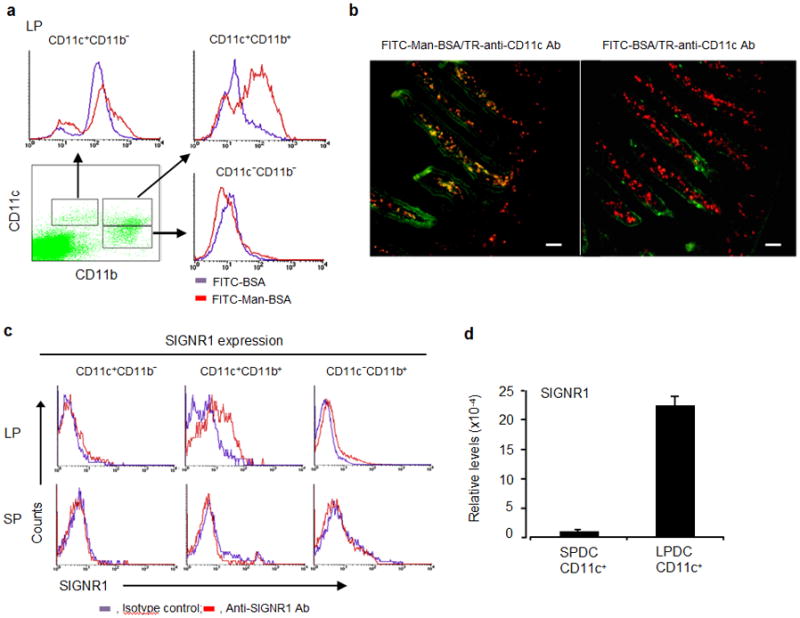
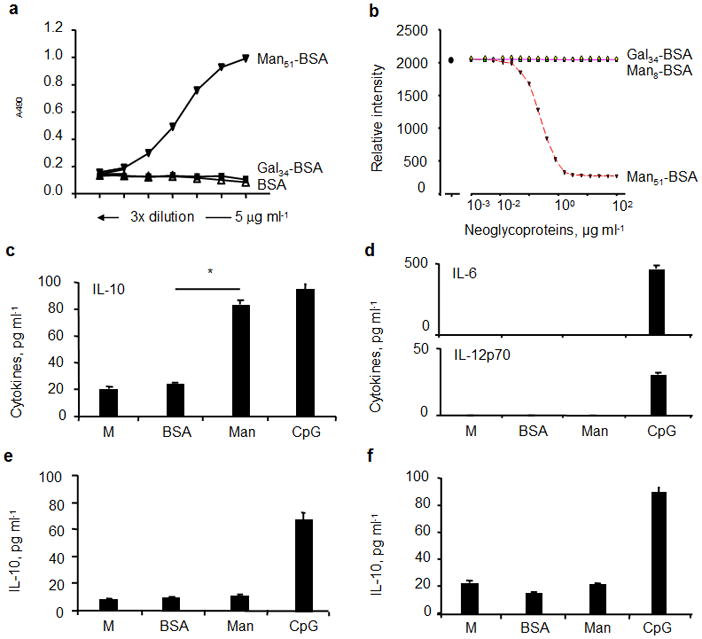
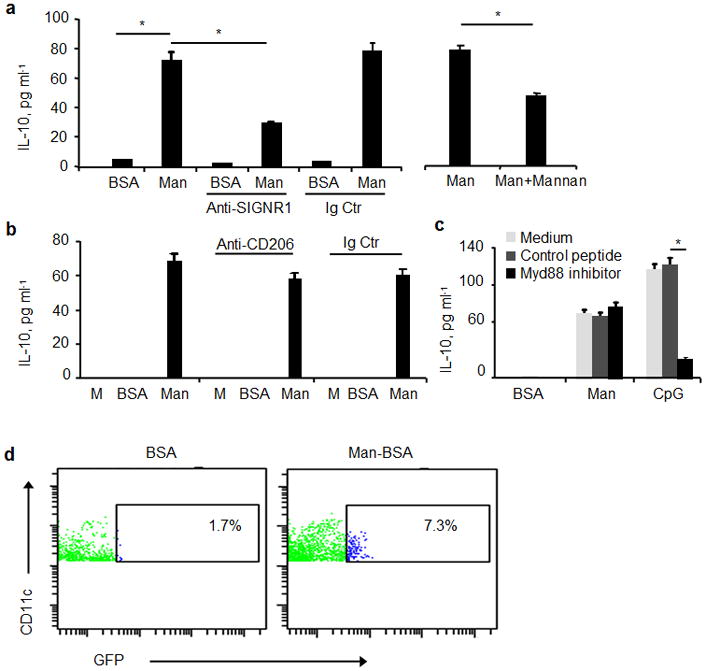
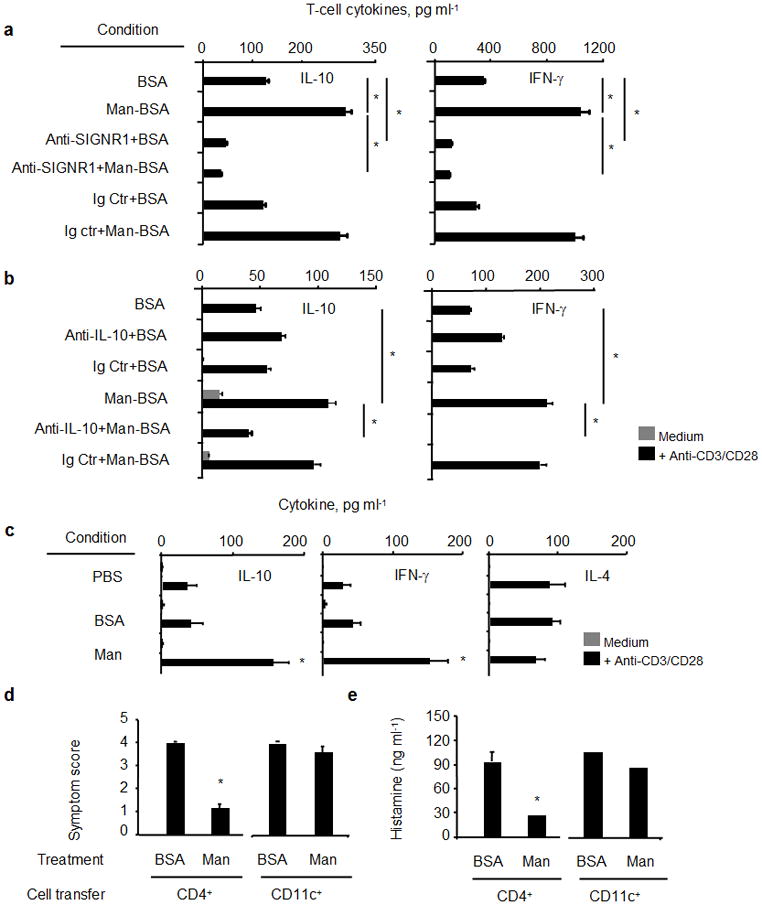
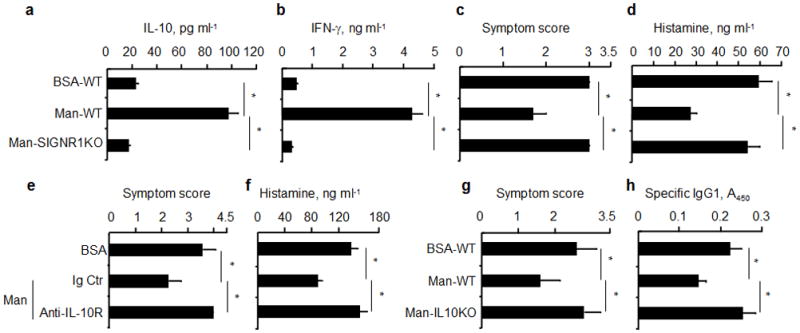
We propose that a C-type lectin receptor, SIGNR-1 (also called Cd209b), helps to condition dendritic cells (DCs) in the gastrointestinal lamina propria (LPDCs) for the induction of oral tolerance in a model of food-induced anaphylaxis. Oral delivery of BSA bearing 51 molecules of mannoside (Man(51)-BSA) substantially reduced the BSA-induced anaphylactic response. Man(51)-BSA selectively targeted LPDCs that expressed SIGNR1 and induced the expression of interleukin-10 (IL-10), but not IL-6 or IL-12 p70. We found the same effects in IL-10-GFP knock-in (tiger) mice treated with Man(51)-BSA. The Man(51)-BSA-SIGNR1 axis in LPDCs, both in vitro and in vivo, promoted the generation of CD4(+) type 1 regulatory T (Tr1)-like cells that expressed IL-10 and interferon-γ (IFN-γ), in a SIGNR-1- and IL-10-dependent manner, but not of CD4(+)CD25(+)Foxp3(+) regulatory T cells. The Tr1-like cells could transfer tolerance. These results suggest that sugar-modified antigens might be used to induce oral tolerance by targeting SIGNR1 and LPDCs.


Figures

Figure 1
Figure 1
Antigen-induced anaphylaxis in C3H/Hej mice. (a) Mice were sensitized with PBS, BSA (200 μg/mouse) or Man51-BSA (Man, 200 μg/mouse) with CTX (10 μg/mouse) and challenged with BSA (1 mg/mouse). The severity of anaphylactic responses was scored 30 min after antigen challenge by the scoring system- from 0, no sign of shock to 5, death. (b) Man51-BSA suppressed BSA-induced anaphylaxis. Mice were pretreated daily on three consecutive days with BSA or Man51-BSA (Man) at 200 μg/mouse, followed by oral sensitization and challenge with BSA. *p < 0.05. (c) The levels of plasma histamine in the same groups of mice as in (b). (d) The relative levels of specific IgE, IgG1 and IgG2a Abs in naïve mice and those after the treatment (before BSA sensitization) with BSA or Man51-BSA, or those after BSA sensitization. *p < 0.05 vs BSA. 8–14 mice per group. Adoptive transfer of splenocytes suppressed BSA-induced anaphylaxis. (e) Symptom scores and (f) plasma histamine levels in sensitized and challenged mice receiving spleen cell transfer from BSA- or Man51-BSA (Man)-treated mice. *p < 0.05. 6–8 mice per group. (g) Representative flow analysis of splenic Foxp3+ Tregs in BSA- or Man51-BSA (Man-BSA)-treated mice. The % of CD25+Foxp3+ cells gated on CD4+ cells and the relative intensity (MFI) of Foxp3 are shown. 3–5 mice per group. Results are representative of 2 independent experiments.
Figure 2
Figure 2
Man51-BSA targeted LPDC subset in lamina propria. (a) A representative flow analysis of three major LP DC or macrophage subsets in mice receiving oral administration of FITC-BSA or FITC-Man51-BSA (Man-BSA). (b) Immunocytochemical analysis of small intestine samples from the same groups of mice as above. Two-color merge pictures are shown. Scale bar, 50 μm. (c) Flow analysis of SIGNR1 expression in three cell subsets from lamina propria (LP) and spleen (SP). (d) The relative levels of SIGNR1 gene expression in LP CD11c+ or splenic CD11+ DCs, measured by the use of quantitative RT-PCR.
Figure 3
Figure 3
Binding analysis of neoglyco-antigens. (a) Solid-phase binding analyses. The relative binding activity was expressed as absorbance at 490 nm after subtracting the background. (b) Representative competition analysis. The mean fluorescence intensity (MFI) of SIGNR1-transfectants stained with FITC-labeled dextran (10 μg/ml; Dextran-FITC) in the presence or absence of varying concentrations of neoglyco-antigens as competitors as indicated, using flow cytometry. Man51-BSA selectively induced IL-10 in LPDCs. The levels of (c) IL-10, (d) IL-6 and IL-12p70 in CD11c+ DCs from LPs. (e) The levels of IL-10 in LP CD11cCD11b+ cells and (f) in CD11c+ DCs of spleens (SP). Cells were stimulated with medium alone (M), BSA (20 μg/ml), Man51-BSA (Man, 20 μg/ml), or 1 μM of CpG for 24 hrs.*p < 0.05.
Figure 4
Figure 4
Inhibition analyses of Man51-BSA-induced IL-10 in LPDCs. The levels of IL-10 in CD11c+ LPDCs (2×10⁵/condition) stimulated with medium alone (M), BSA (20 μg/ml) or Man51-BSA (Man, 20 μg/ml) with or without the addition of (a) a blocking SIGNR1-specific antibody (50μg/ml), isotype control (Ig Ctr), or in separate assays, mannan (20 μg/ml), or (b) antibody specific to mannose receptor (CD206; 50 μg/ml), isotype control (Ig Ctr), or (c) pretreated with a MyD88 peptide inhibitor or a control peptide (200 μM). Also, DCs were stimulated with 1 μM CpG in separate cultures for comparison. The levels of IL-10 in LPDCs after 24 hrs simulation were measured with ELISA. *p < 0.05. (d) Flow analysis of CD11c+GFP+ (IL-10+) cells in lamina propria (LP) of IL-10-GFPtiger mice.
Figure 5
Figure 5
Increased IL-10- and IFN-γ expression in T cells in vitro when co-cultured with Man51-BSA (Man) pulsed LPDCs (CD11c+), in the presence or absence of (a) SIGNR1-specific or isotype control (Ig Ctr) antibodies, (b) neutralizing IL-10-specific (5 μg/ml) or isotype control (Ig Ctr) antibodies. T-cell cytokines, IL-10 and IFN-γ, were measured by ELISA. (c) Increased IL-10-and IFN-γ-expressing T cells from mice receiving oral administration of PBS, BSA or Man51-BSA (Man, 200 μg/mouse). *p < 0.05 vs PBS or BSA. Adoptive transfer of splenic CD4+ T cells suppressed BSA-induced anaphylaxis. (d) Symptom scores and (e) plasma histamine levels in sensitized and challenged mice receiving transfers of CD4+ T cells or CD11c+ DCs from BSA- or Man51-BSA (Man)-treated mice. *p < 0.05. 6–8 mice per group.
Figure 6
Figure 6
Reversal of Man51-BSA-mediated tolerance in SIGNR1- and IL-10-deficient mice. Analysis of (a) IL-10 and (b) IFN-γ in splenic CD4+ T cells from wild-type (WT) or SIGNR1-deficient (SIGNR1KO) mice receiving oral administration of BSA or Man51-BSA (Man) and stimulated. *p < 0.05. (c) Symptom scores and (d) plasma histamine levels in sensitized and challenged wild-type and SIGNR1-deficient mice. *p<0.05. 6–8 mice per group. (e) Symptom scores and (f) plasma histamine levels in BSA- or Man51-BSA (Man)-treated C3H/hej mice receiving IL-10R-specific or isotype control (Ig Ctr) antibodies as indicated. *p < 0.05. 4–6 mice per group. Antigen-induced (g) symptom scores and (h) specific IgG1 response in mice (wild-type) receiving adoptive transfer of splenic CD4+ T cells from BSA- or Man51-BSA (Man)-treated IL-10-deficient (IL10KO) or wild-type (WT) mice. *p < 0.05. 4–6 mice per group.

Comment in

References

    1. Coombes JL, Powrie F. Dendritic cells in intestinal immune regulation. Nat Rev Immunol. 2008;8:435–46. - PMC - PubMed
    1. Chehade M, Mayer L. Oral tolerance and its relation to food hypersensitivities. J Allergy Clin Immunol. 2005;115:3–12. - PubMed
    1. Poulsen LK. In search of a new paradigm: mechanisms of sensitization and elicitation of food allergy. Allergy. 2005;60:549–58. - PubMed
    1. Finkelman FD. Anaphylaxis: Lessons from mouse models. J Allergy Clin Immunol. 2007;120:506–15. - PubMed
    1. Izcue A, Coombes JL, Powrie F. Regulatory lymphocytes and intestinal inflammation. Annu Rev Immunol. 2009;27:313–38. - PubMed

Publication types