

Bone regeneration in surgically created defects filled with autogenous bone: an epifluorescence microscopy analysis in rats
- PMID: 20835568
- PMCID: PMC5349066
- DOI: 10.1590/s1678-77572010000400005
Bone regeneration in surgically created defects filled with autogenous bone: an epifluorescence microscopy analysis in rats
Abstract
Although the search for the ideal bone substitute has been the focus of a large number of studies, autogenous bone is still the gold standard for the filling of defects caused by pathologies and traumas, and mainly, for alveolar ridge reconstruction, allowing the titanium implants installation.
Objectives: The aim of this study was to evaluate the dynamics of autogenous bone graft incorporation process to surgically created defects in rat calvaria, using epifluorescence microscopy.
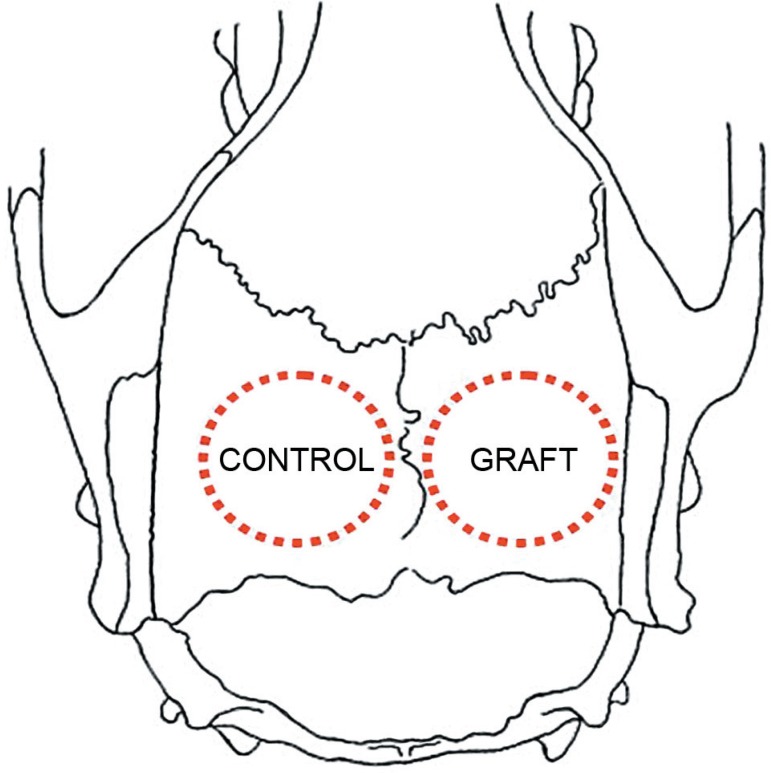
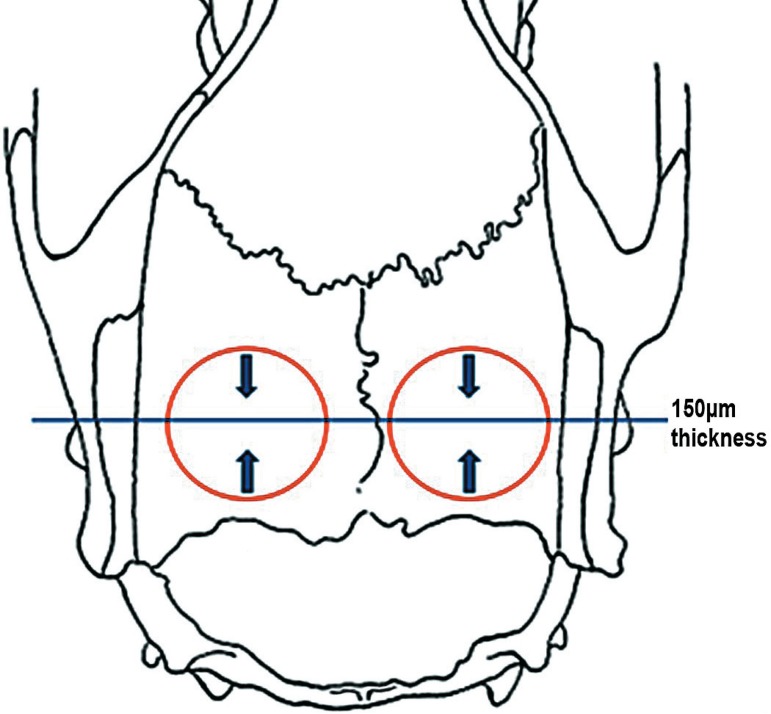
Material and methods: Five adult male rats weighing 200-300 g were used. The animals received two 5-mm-diameter bone defects bilaterally in each parietal bone with a trephine bur under general anesthesia. Two groups of defects were formed: a control group (n=5), in which the defects were filled with blood clot, and a graft group (n=5), in which the defects were filled with autogenous bone block, removed from the contralateral defect. The fluorochromes calcein and alizarin were applied at the 7th and 30th postoperative days, respectively. The animals were killed at 35 days.
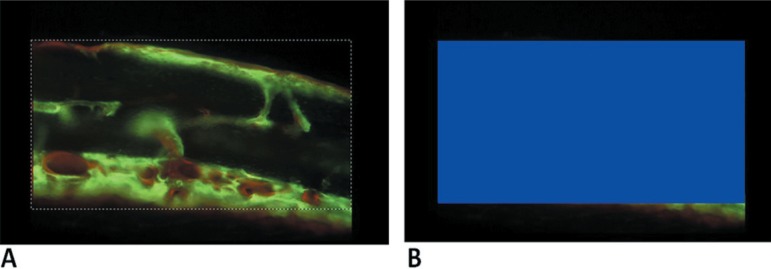
Results: The mineralization process was more intense in the graft group (32.09%) and occurred mainly between 7 and 30 days, the period labeled by calcein (24.66%).
Conclusions: The fluorochromes showed to be appropriate to label mineralization areas. The interfacial areas between fluorochrome labels are important sources of information about the bone regeneration dynamics.
Figures


References
-
- Bosch C, Melsen B, Vargervik K. Importance of the critical-size bone defect in testing bone-regeneration materials. J Craniofac Surg. 1998;9(4):310–316. - PubMed
-
- Brånemark PI, Lindström J, Hallén O, Breine U, Jeppson PH, Ohman A. Reconstruction of the defective mandible. Scand J Plastic Reconst Surg. 1975;9:116–128. - PubMed
-
- Busch O, Solheim E, Bang G, Tornes K. Guided tissue regeneration and local delivery of insulinlike growth factor I by bioerodible polyorthoester membranes in rat calvarial defects. Int J Oral Maxillofac Implants. 1996;11(4):498–505. - PubMed
-
- Burchardt H. The biology of bone graft repair. Clin Orthop Relat Res. 1983;174:28–42. - PubMed
-
- Constantino PD, Hiltzik D, Govindaraj S, Moche J. Bone healing and bone substitutes. Facial Plast Surg. 2002;18(1):13–26. - PubMed
MeSH terms
Substances
LinkOut - more resources
Full Text Sources
Medical
