

Acid-base balance and hydration status following consumption of mineral-based alkaline bottled water
- PMID: 20836884
- PMCID: PMC3161391
- DOI: 10.1186/1550-2783-7-29
Acid-base balance and hydration status following consumption of mineral-based alkaline bottled water
Abstract
Background: The present study sought to determine whether the consumption of a mineral-rich alkalizing (AK) bottled water could improve both acid-base balance and hydration status in young healthy adults under free-living conditions. The AK water contains a naturally high mineral content along with Alka-PlexLiquid, a dissolved supplement that increases the mineral content and gives the water an alkalizing pH of 10.0.
Methods: Thirty-eight subjects were matched by gender and self-reported physical activity (SRPA, hrs/week) and then split into Control (12 women, 7 men; Mean +/- SD: 23 +/- 2 yrs; 7.2 +/- 3.6 hrs/week SRPA) and Experimental (13 women, 6 men; 22 +/- 2 yrs; 6.4 +/- 4.0 hrs/week SRPA) groups. The Control group consumed non-mineralized placebo bottled water over a 4-week period while the Experimental group consumed the placebo water during the 1st and 4th weeks and the AK water during the middle 2-week treatment period. Fingertip blood and 24-hour urine samples were collected three times each week for subsequent measures of blood and urine osmolality and pH, as well as total urine volume. Dependent variables were analyzed using multivariate repeated measures ANOVA with post-hoc focused on evaluating changes over time within Control and Experimental groups (alpha = 0.05).
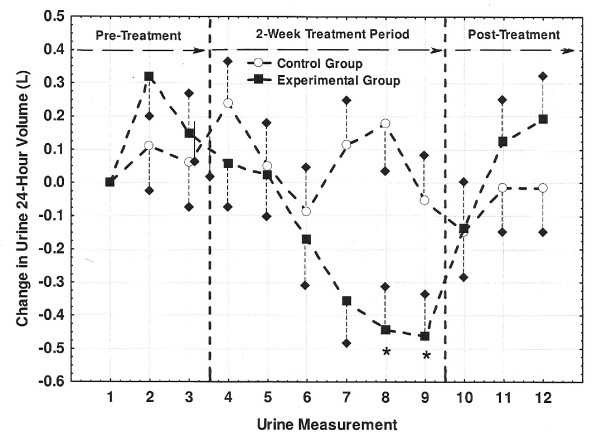
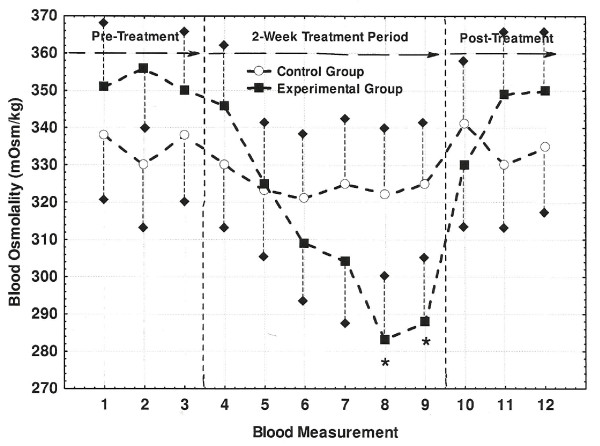
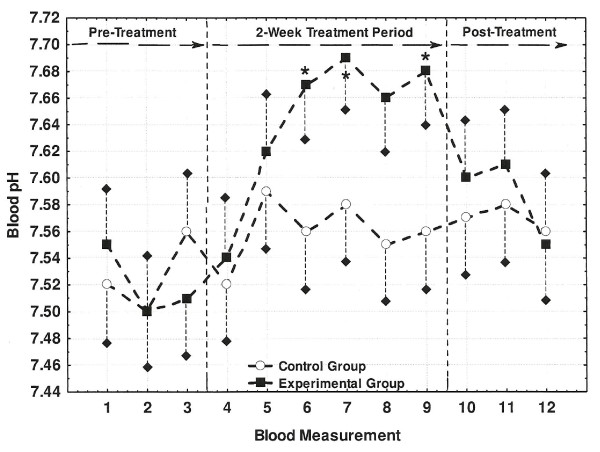
Results: There were no significant changes in any of the dependent variables for the Control group. The Experimental group, however, showed significant increases in both the blood and urine pH (6.23 to 7.07 and 7.52 to 7.69, respectively), a decreased blood and increased urine osmolality, and a decreased urine output (2.51 to 2.05 L/day), all during the second week of the treatment period (P < 0.05). Further, these changes reversed for the Experimental group once subjects switched to the placebo water during the 4th week.
Conclusions: Consumption of AK water was associated with improved acid-base balance (i.e., an alkalization of the blood and urine) and hydration status when consumed under free-living conditions. In contrast, subjects who consumed the placebo bottled water showed no changes over the same period of time. These results indicate that the habitual consumption of AK water may be a valuable nutritional vector for influencing both acid-base balance and hydration status in healthy adults.
Figures
References
-
- Wynn E, Lanham-New SA, Krieg M, Whittamore DR, Burckhardt P. Low estimates of dietary acid load are positively associated with bone ultrasound in women older than 75 years of age with a lifetime fracture. J Nutr. 2008;138:1349–1354. - PubMed
-
- Rubenowitz E, Axelsson G, Rylander R. Magnesium and calcium in drinking water and death from acute myocardial infarction. Am J Epidemiol. 1996;143(5):456–462. - PubMed
-
- Rubenowotz E, Molin I, Axelsson G, Rylander R. Magnesium in drinking water in relation to morbidity and mortality from acute myocardial infarction. Epi. 2000;11:416–421. - PubMed
LinkOut - more resources
Full Text Sources