. 2010 Dec;139(6):2170-82.
doi: 10.1053/j.gastro.2010.09.002. Epub 2010 Sep 15.

Expansion of hepatic tumor progenitor cells in Pten-null mice requires liver injury and is reversed by loss of AKT2

Affiliations

Expansion of hepatic tumor progenitor cells in Pten-null mice requires liver injury and is reversed by loss of AKT2

Vivian A Galicia et al. Gastroenterology. 2010 Dec.

Abstract

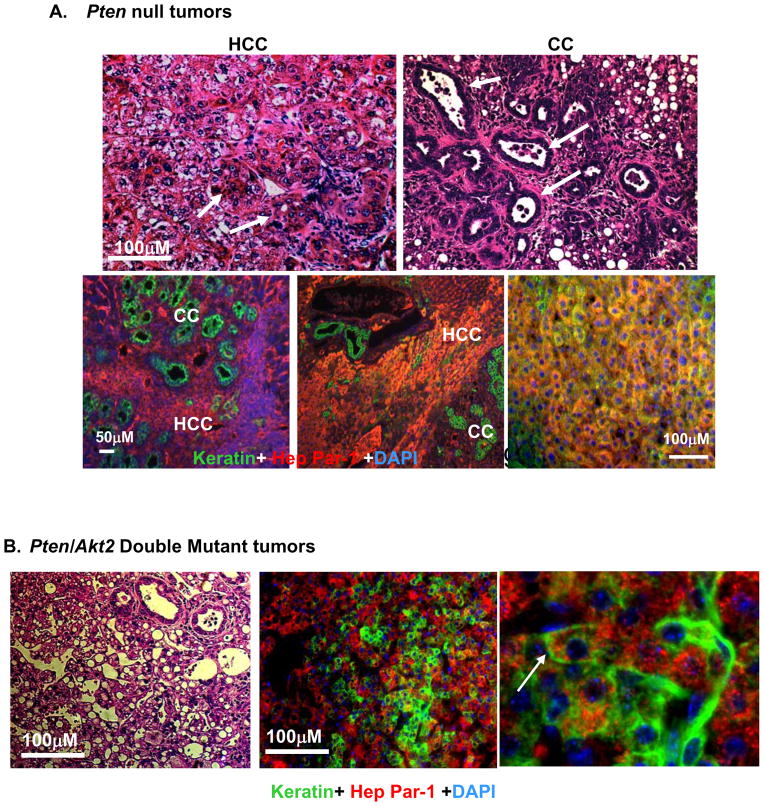
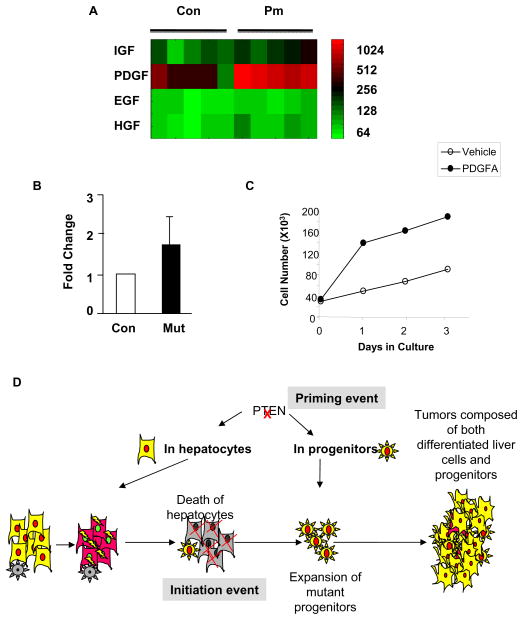
Background & aims: The tumor suppressor PTEN inhibits AKT2 signaling; both are aberrantly expressed in liver tumors. We investigated how PTEN and AKT2 regulate liver carcinogenesis. Loss of PTEN leads to spontaneous development of liver tumors from progenitor cells. We investigated how the loss of PTEN activates liver progenitor cells and induces tumorigenesis.

Methods: We studied mice with liver-specific disruptions in Pten and the combination of Pten and Akt2 to investigate mechanisms of liver carcinogenesis.

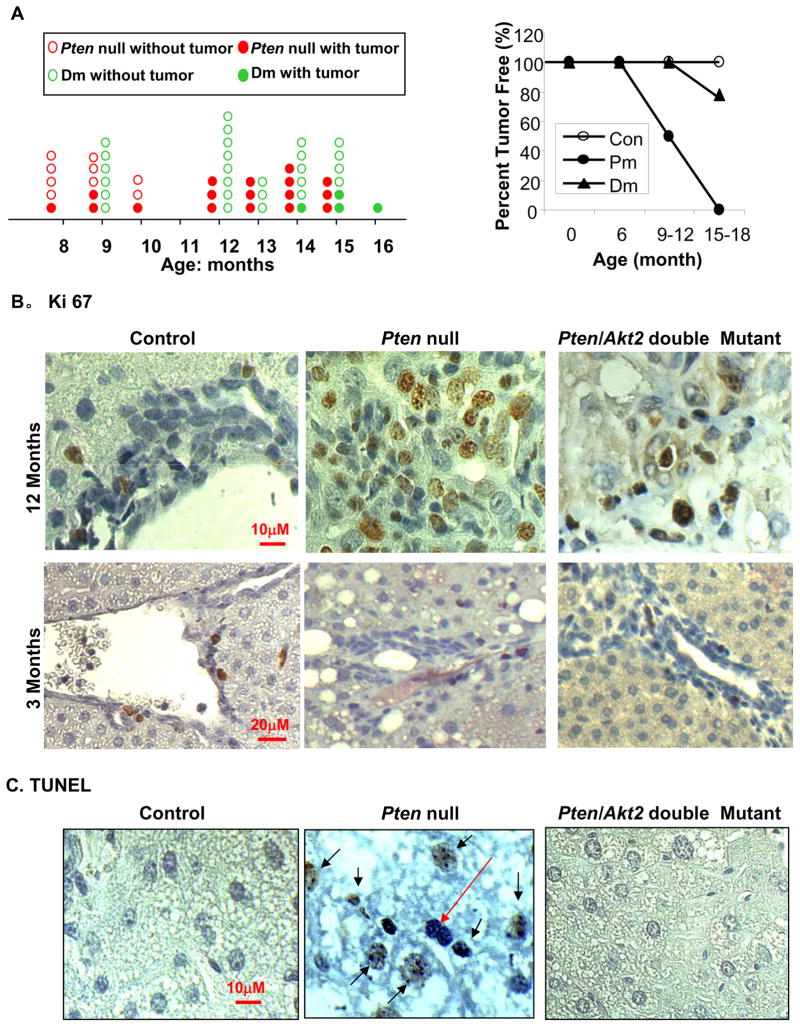
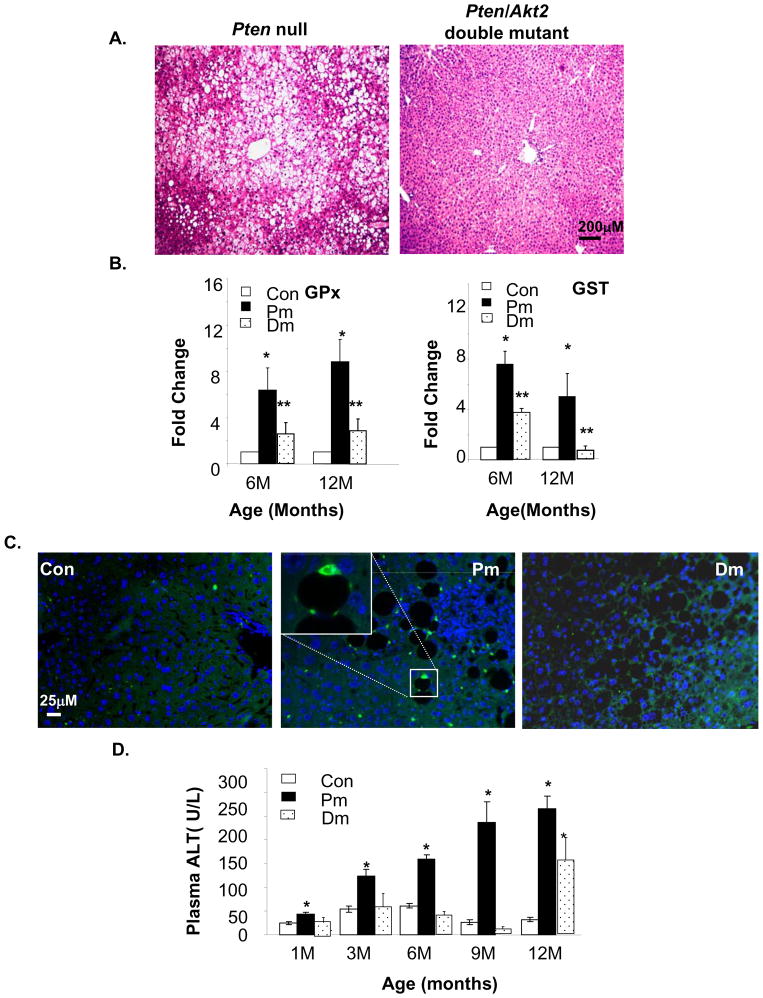
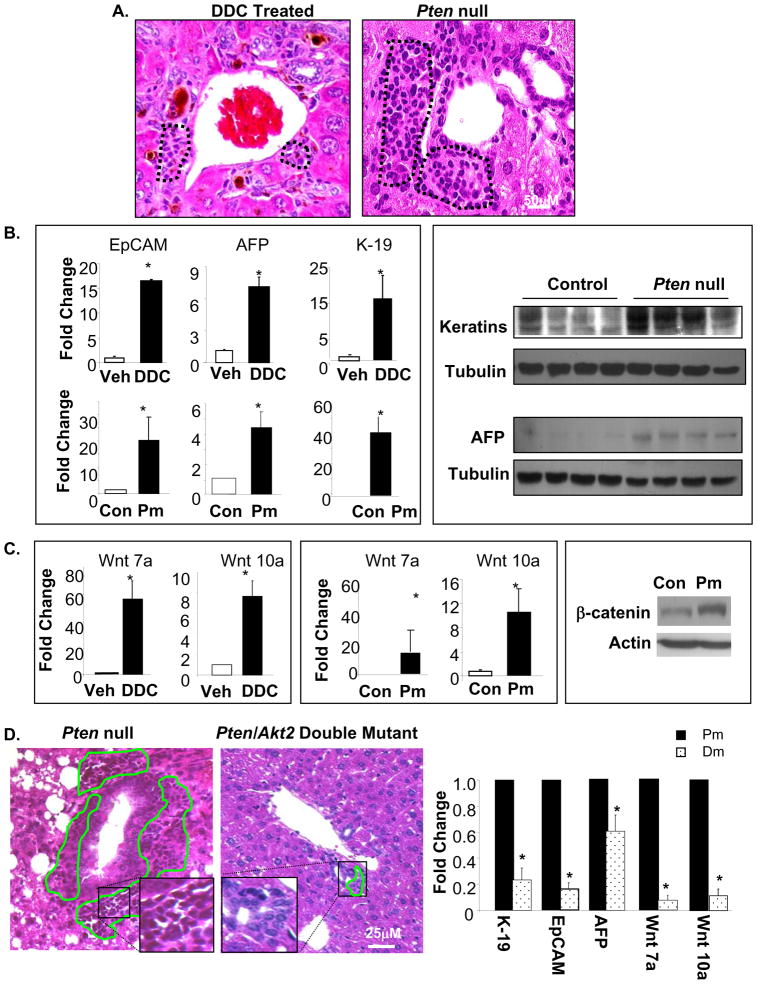
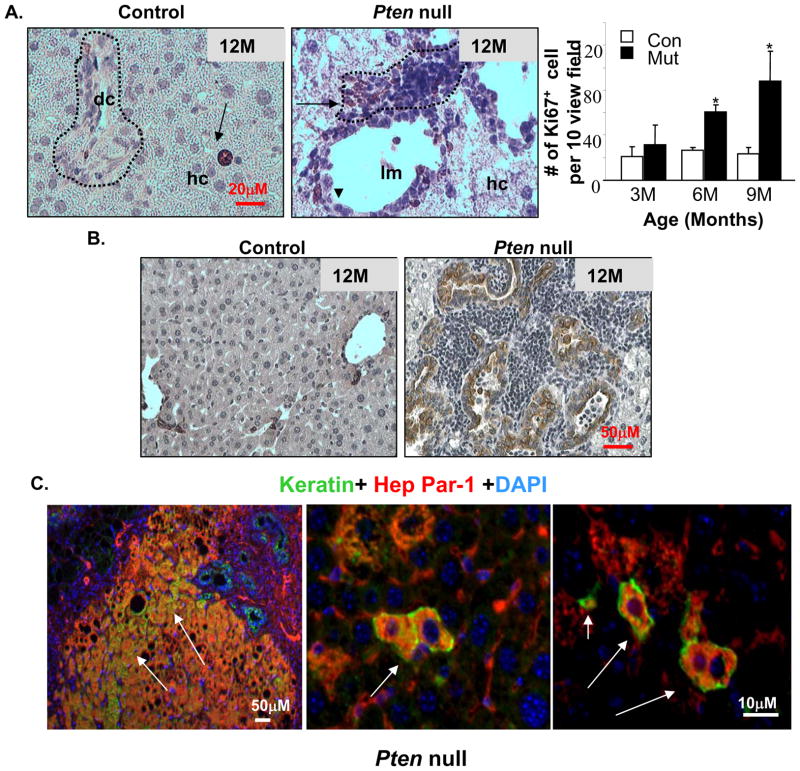
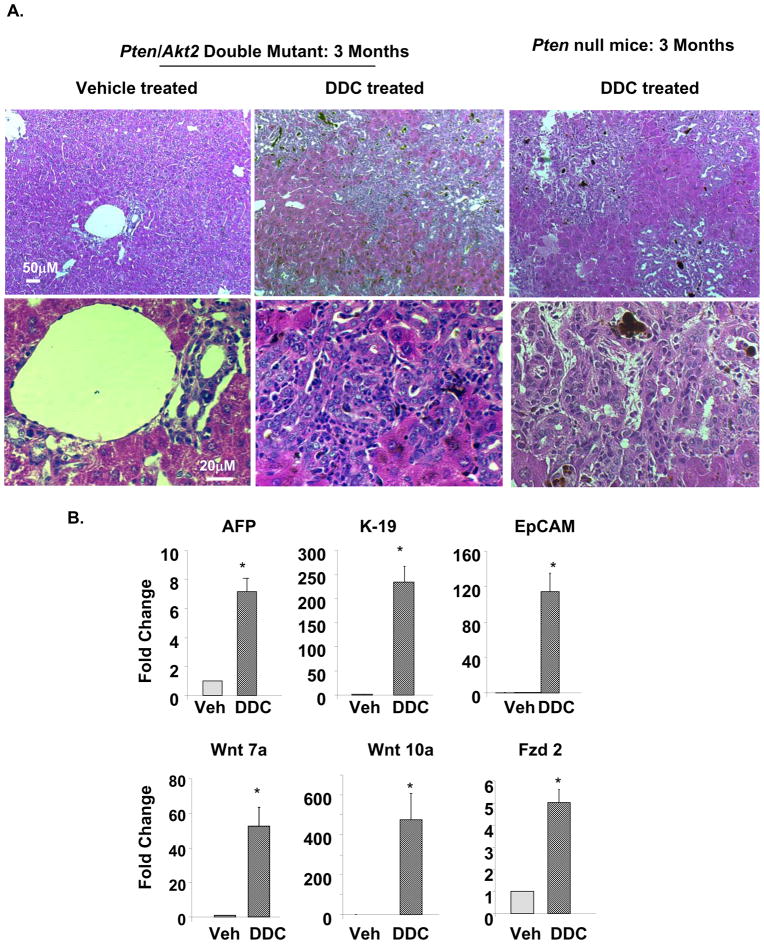
Results: PTEN loss leads to hepatic injury and establishes selective pressure for tumor-initiating cells (TICs), which proliferate to form mixed-lineage tumors. The Pten-null mice had increasing levels of hepatic injury before proliferation of hepatic progenitors. Attenuation of hepatic injury by deletion of Akt2 reduced progenitor cell proliferation and delayed tumor development. In Pten/Akt2-null mice given 3,5-diethoxycarbonyl-1,4 dihydrocollidine (DDC), we found that the primary effect of AKT2 loss was attenuation of hepatic injury and not inhibition of progenitor-cell proliferation in response to injury.

Conclusions: Liver carcinogenesis in Pten-null mice requires not only the transformation of TICs but selection pressure from hepatic injury and cell death, which activates TICs. Further research is required to elucidate the mechanism for hepatic injury and its relationship with TIC activation.


Conflict of interest statement

There are no conflicts of interest to disclose for all authors.

Figures

Figure 1
Figure 1. Akt2 deletion inhibits tumor growth in Pten null mice
A. Left panel, tumor spectrum. Each red circle represents one Pten null (Pm) mouse. Each green circle represents one Pten/Akt2 double mutant (Dm) mouse. The solid circles represent mice with tumors and open circles represent mice with tumors. Right panel, tumor data presented as percentage of the total number of animals evaluated. B. Liver sections were stained with a cell proliferation marker Ki67 (brown nuclei staining). Top panel, 12 month old mice. Bottom panel, 3 month-old mice. C. Liver sections were stained with TUNEL (brown nuclei staining) to identify apoptotic cells. All sections were counterstained with hematoxylin for nuclei identification. Black arrows: TUNEL positive cells. Red arrow: TUNEL negative cells.
Figure 2
Figure 2. Akt2 deletion inhibits liver injury induced by Pten deletion in the liver
A. Representative H&E image show liver steatosis in 3 months old Pten null (Pm) mice and not in the Pten/Akt2 double mutant (Dm) mice. B. qPCR analysis reveals higher expression of GPx and GST in Pm than in Dm and Controls. Values are expressed as fold change vs. Controls (set as 1). C. Immunostaining with anti-4-HNE shows accumulation of lipid peroxidation aggregates (green fluorescent stained spots) in the Pm liver. The sections are also stained with DAPI (blue) for nuclei. D. Liver injury is measured by serum ALT quantification. All values are expressed as the mean ± SEM. * indicates significant difference from Controls (p≤0.05). ** indicates significant difference from Pm (p≤0.05). n=5.
Figure 3
Figure 3. Deletion of Akt2 inhibits expansion of liver progenitor cells observed in Pten null mice
A. H&E stains of liver sections from DDC treated mice demonstrate progenitor cell accumulation at the portal vein (circled, left panel). Pten deletion (Pm) causes a similar accumulation of progenitor cells in portal areas at 9 months of age (circled, right panel). B. Left panel, qPCR analysis of hepatic progenitor markers EpCAM (left), AFP (middle), and K-19 (right). Top, DDC treated vs. vehicle; Bottom, Pm vs. Controls (Con). Right panel, Western analysis of AFP and Keratin protein levels in Control and Pm mice. Tubulin is detected as loading control. C. Left panel, qPCR analysis of Wnt 7a and 10a in DDC vs. vehicle treated mice. Middle panel, qPCR analysis of Wnt 7a and 10a in Pm vs. Control (Con) mice. Right panel, analysis of β-catenin protein levels in cells isolated from livers of Con and Pm mice. β-actin is detected as loading control. D. Left panel, H&E staining shows multiple layers of progenitor cells surrounding the ductal structures in the Pm liver (left). Progenitor cells accumulation is limited in the Dm liver (middle). Expression of EpCAM, AFP, K-19, and Wnt7a/10a are reduced in Dm vs. Pm livers (right). Data expressed as fold change over Pm (set as 1). All values expressed as the mean ± SEM. * indicates significant difference between the two groups (p≤0.05). n=5.
Figure 4
Figure 4. Proliferation and differentiation of progenitor cells in the Pten null mice
A. Immunohistochemical staining with Ki67 (brown stained nucleus) shows that mitotic activity is predominantly found in the peri-ductal region (arrows) in the liver progenitor cell niche (dotted circle) in Pm mice (middle). Arrow heads, ductal cells. Control livers contain few proliferating hepatocytes (arrow in left panel), and low mitotic activity at the portal triad (circled area, left panel). Right, quantification of ki67 positive cells. Values expressed as the mean ± SEM. * indicates values that are significantly different at p≤0.05. n=5. B. Immunohistochemical staining with keratin (brown stain) revealed an increase in ductal lineage cells associated with the expansion of hepatic progenitors. C. Identification of bi-lineage progenitor cells (arrows) coexpressing hepatocyte (HepPar-1) and cholangiocyte (keratin) markers in the Pm liver. Red, Hep-Par; Green, Keratin; Blue, DAPI.
Figure 5
Figure 5. Deletion of Akt2 does not alter the mixed cell tumor phenotype in liver specific Pten null mice
A. Top, H&E images of tumors developed in the Pten null mice demonstrate compact trabecular growth patterns and pseudoglandular structures of HCC (arrows, left panel); and tubular features of CC (arrows, right panel). Bottom, Immunohistochemistry of liver tissue with HepPar-1 (red) and keratin (green) in Pm mice identifies HCC and CC respectively. Blue, DAPI. B. H&E section of one of the two tumors formed in the Pten/Akt2 double mutant liver (left panel). Immunochemical staining confirms bilineage tumor development with both Hep Par-1 (red) and keratin (green) (right two panels). Arrow point to bilineage cells expressing both markers.
Figure 6
Figure 6. Deletion of Akt2 in the Pten null liver does not hinder the proliferation of progenitor cells in response to DDC treatment
A. Three months Pten null (Pm) and Pten/Akt2 double mutant (Dm) mice were treated with DDC to induce the expansion of progenitor cells. Both groups of mice responded to DDC treatment with progenitor cell expansion phenotypes. Top panel, low magnification images showing the extent of liver damage and progenitor cell expansion. Bottom panel, high magnification images show progenitor cell morphology. B. Markers for progenitor cells, AFP, K-19 and EpCAM are induced when Dm mice are treated with DDC vs. vehicle (Veh, top panel). The markers for progenitor cell niche Wnt 7a and 10a and Fzd2, a receptor for Wnt are also induced in the DDC treated Dm mice (bottom panel). Data presented as mean±SEM. * indicates values that are significantly different from that of vehicle controls at p≤0.05. n=5.
Figure 7
Figure 7. PDGF is potential growth factor mediating the progenitor cell expansion in the Pten null mice
A. Heatmap of microarray analysis of expression for IGF, PDGF, EGF and HGF. Expression of PDGF is robustly induced in the Pten null (Pm) mice vs. the Controls. Each square represents one mouse. Relative level of expression is indicated with color intensity. Color scale (log scale) is provided as reference. B. Quantitative PCR data confirming the upregulation of PDGF in the Pm liver. C. Growth curve of PDGF and vehicle treated progenitor cell cultures. Solid circle, PDGF (25ng/ml) treated culture; Open circle, vehicle treated culture. D. Schematic representation of tumor progression in the Pten null mice.

References

    1. Polyak K, Weinberg RA. Transitions between epithelial and mesenchymal states: acquisition of malignant and stem cell traits. Nature reviews. 2009;9:265–273. - PubMed
    1. Visvader JE, Lindeman GJ. Cancer stem cells in solid tumours: accumulating evidence and unresolved questions. Nature reviews. 2008;8:755–768. - PubMed
    1. Alison MR. Liver stem cells: implications for hepatocarcinogenesis. Stem cell reviews. 2005;1:253–260. - PubMed
    1. Roskams TA, Libbrecht L, Desmet VJ. Progenitor cells in diseased human liver. Seminars in liver disease. 2003;23:385–396. - PubMed
    1. Dunsford HA, Karnasuta C, Hunt JM, Sell S. Different lineages of chemically induced hepatocellular carcinoma in rats defined by monoclonal antibodies. Cancer research. 1989;49:4894–4900. - PubMed

Publication types

MeSH terms

Substances