. 2010 Nov 12;285(46):36245-54.
doi: 10.1074/jbc.M110.126003. Epub 2010 Sep 13.

Slc35c2 promotes Notch1 fucosylation and is required for optimal Notch signaling in mammalian cells

Affiliations

Slc35c2 promotes Notch1 fucosylation and is required for optimal Notch signaling in mammalian cells

Linchao Lu et al. J Biol Chem. .

Abstract

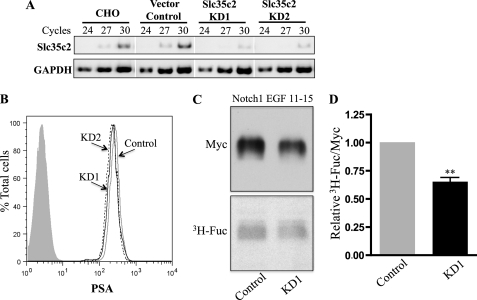
Mammalian Notch receptors require modification by fucose on epidermal growth factor-like (EGF) repeats of their extracellular domain to respond optimally to signal induction by canonical Notch ligands. Inactivation of the Golgi GDP-fucose transporter Slc35c1 in mouse or human does not cause marked defects in Notch signaling during development, and shows milder fucosylation defects than those observed in mice unable to synthesize GDP-fucose, indicating the existence of another mechanism for GDP-fucose transport into the secretory pathway. We show here that fibroblasts from mice or humans lacking Slc35c1 exhibit robust Notch signaling in co-culture signaling assays. A potential candidate for a second GDP-fucose transporter is the related gene Slc35c2. Overexpression of Slc35c2 reduces expression of the fucosylated epitopes Lewis X and sialylated Lewis X in CHO cells, indicating competition with Slc35c1. The fucosylation of a Notch1 EGF repeat fragment that occurs in the endoplasmic reticulum was increased in CHO transfectants overexpressing Slc35c2. In CHO cells with low levels of Slc35c2, both Delta1- and Jagged1-induced Notch signaling were reduced, and the fucosylation of a Notch1 fragment was also decreased. Immunofluorescence microscopy of rat intestinal epithelial cells and HeLa cells, and analysis of rat liver membrane fractions showed that Slc35c2 is primarily colocalized with markers of the cis-Golgi network and endoplasmic reticulum-Golgi intermediate compartment (ERGIC). The combined results suggest that Slc35c2 is either a GDP-fucose transporter that competes with Slc35c1 for GDP-fucose, or a factor that otherwise enhances the fucosylation of Notch and is required for optimal Notch signaling in mammalian cells.


Figures

FIGURE 1.
FIGURE 1.
Ligand-induced Notch signaling in Slc35c1−/− MEFs. A, PCR genotyping of Slc35c1−/− and Slc35c1+/+ MEFs was performed as described under “Experimental Procedures.” B, Slc35c1−/− (black line; C1−/−) and Slc35c1+/+ (gray line; C1+/+) MEFs were analyzed by flow cytometry for cell surface glycans containing a terminal fucose using biotinylated AAL. The shaded profile is the secondary antibody alone. C, flow cytometric analysis demonstrated equivalent binding of FITC-conjugated L-PHA to complex N-glycans in C1+/+ and C1−/− MEFs. The shaded profile is the unstained Slc35c1−/− MEFs. D, C1+/+ (white bars) and C1−/− (black bars) MEFs were transfected with TP-1 reporter and control plasmids and co-cultured with Delta1/L, Jagged1/L, or L cells. Notch signaling was determined as the ratio of firefly:Renilla luciferase activities. One representative experiment is shown. E, ligand-induced Notch signaling determined by fold-activation and normalized to 100% based on C1+/+. Error bars are S.E. (n = 3 independent experiments); *, p < 0.05 based on a one-tailed (Delta1/L); ***, p < 0.0001 based on a two-tailed (Jagged1/L) Student's t test.
FIGURE 2.
FIGURE 2.
Notch1 activation in LADII fibroblasts. A, LADII (black line) and control (gray line) fibroblasts were examined for binding of biotinylated-AAL by flow cytometry detected by FITC-streptavidin. The shaded profile is FITC-streptavidin alone. B, binding of FITC-conjugated PSA. The shaded profile is unstained LADII fibroblasts. C, binding of FITC-conjugated L-PHA. The shaded profile is unstained LADII fibroblasts. D, LADII and control fibroblasts were co-cultured with Delta1/L, Jagged1/L cells, or control ligand cells (L). After 6 h, lysates were analyzed by Western blot using anti-N1Val1744 antibody. Cleaved endogenous Notch1 (N1-ICD) was at 110 kDa. The asterisk indicates nonspecific bands on the same gel. The lower panel in D served as loading control. This is representative of 4 independent experiments. E, the experiment in D was performed for LADII fibroblasts incubated with 2 μm GSI L-685,458 or DMSO in the co-culture medium. Mouse β-actin was a loading control. This is a representative result from 2 independent experiments.
FIGURE 3.
FIGURE 3.
Slc35c2 inhibits some fucosylation. A, LEC11B cells stably expressing CHO Slc35c2 (C2; black line) or empty vector (Vec; gray line) were assayed for binding of mouse anti-SSEA-1 antibody by flow cytometry. The shaded profile is the secondary antibody alone. B and C, CHO cells transiently transfected with cDNAs encoding CHO Fut6B (B) or Fut9 (C) together with CHO Slc35c2 cDNA (C2; black line) or empty vector (Vec; gray line) were assayed for binding of mouse anti-SSEA-1 antibody by flow cytometry. The shaded profile is the secondary antibody alone. D, binding of FITC-conjugated PSA as in A. The shaded profile is unstained LEC11B cells.
FIGURE 4.
FIGURE 4.
Slc35c2 enhances O-fucosylation of a Notch1 fragment. A, Notch1 EGF11–15 was transfected into LEC11B CHO cells stably expressing CHO Slc35c2 or empty vector. Cells were metabolically labeled with l-[3H]fucose, and Notch1 EGF11–15 harvested by Ni2+ beads was analyzed by Western blot with anti-Myc mAb and autoradiography to detect [3H]fucose. B, blots were quantitated by NIH Image J and the relative ratios of [3H]fucose incorporated versus Myc signal are plotted. Error bar, S.E. (n = 3 independent experiments). Slc35c1−/− MEFs were transiently transfected with mouse Slc35c2 cDNA (C2; black line) or mouse Slc35c1 cDNA (C1; dashed line) or both Slc35c1 and Slc35c2 cDNA (C1+C2; dotted line) and analyzed for binding of biotinylated-AAL (C) or FITC-L-PHA (D). The shaded profile is untransfected Slc35c1−/− MEFs for biotinylated-AAL or unstained Slc35c1−/− MEFs for FITC-conjugated L-PHA, respectively.
FIGURE 5.
FIGURE 5.
Knockdown of Slc35c2 reduces Notch1 EGF11–15 fucosylation. A, RNA from CHO cells stably expressing shRNA targeting the CHO Slc35c2 3′ UTR was analyzed by semi-quantitative RT-PCR for Slc35c2 and GAPDH transcripts. B, flow cytometric analysis demonstrated equivalent binding of FITC-PSA to Slc35c2 knockdown cells (KD1, black line; KD2, dashed line) and vector control (Control; gray line). The shaded profile is unstained CHO cells. C, mouse Notch1 EGF11–15 expressed in Slc35c2-KD1 or vector control cells was labeled with l-[3H]fucose, collected on Ni2+ beads, and analyzed by Western blot using anti-Myc mAb and fluorography. D, NIH Image J was used to quantitate blots and the relative ratios of [3H]fucose per Notch1 fragment normalized to vector control were plotted. Error bar, S.E. (n = 3 independent experiments); **, p < 0.01, based on the two-tailed Student's t test.
FIGURE 6.
FIGURE 6.
Knockdown of Slc35c2 reduces ligand-induced Notch signaling. A, Notch signaling in Slc35c2 knockdown lines (KD1 and KD2) and vector control (Control) using the TP1-luciferase and Renilla luciferase reporter assay. Activation of Notch signaling by Delta1/L or Jagged1/L was determined by the ratio of firefly:Renilla luciferase activities. The values are the average of duplicates from one representative experiment. B, relative activation of Notch signaling in Slc35c2-KD1 and -KD2 normalized to vector control. Error bars, S.E. (n = 4 independent experiments performed in duplicate); **, p < 0.01; ***, p < 0.001, based on the two-tailed Student's t test. C, mouse Notch1 with a C-terminal Myc tag (N1-Myc) was transiently transfected into Slc35c2 knockdown lines (KD1 and KD2) and vector control cells (Control). Delta1-induced Notch1 activation was analyzed by Western blot using N1Val1744 antibody and anti-Myc mAb. Activated Notch1 intracellular domains (N1 ICD) from both endogenous and exogenous N1 were detected. Results of a representative experiment are shown. D, the experiment in C was performed in the presence of 2 μm GSI L-685,458 or DMSO in co-culture medium with Delta1/L cells or control ligand cells (L). Both endogenous and introduced N1 ICDs were blocked by the GSI. E, relative expression of activated Notch1. The quantitation of signals from gels similar to C was performed using NIH Image J. The ratio of activated endogenous Notch1 to loading control (either β-actin or nonspecific band) was normalized to control; the ratio of activated exogenous Notch1 to transfected Notch1 was normalized to control. For endogenous N1 ICD, error bar represent S.E. (n = 4 independent experiments), ***, p < 0.001; for exogenous N1 ICD. Error bars represent S.E. (KD1, n = 5 independent experiments; KD2, n = 4 independent experiments); *, p < 0.05; **, p < 0.01, based on the two-tailed Student's t test.
FIGURE 7.
FIGURE 7.
Slc35c2 is primarily localized to Golgi in rat liver. A, a new polyclonal Ab against mouse and human Slc35c2 was tested on lysates of CHO cells expressing empty vector, mouse Slc35c1-Myc, mouse Slc35c2 with low transfection efficiency (C2(low)), or mouse Slc35c2-Myc and analyzed by Western blotting using anti-Slc35c2 C-terminal peptide antibody or anti-Myc. B, cell lysates from CHO cells transiently transfected with mouse Slc35c2 were treated with Endo H or PNGase F and analyzed by Western blotting using anti-Slc35c2 pAb. The membrane was stripped and re-probed with anti-Pofut1 C-terminal peptide pAb. Western blotting was performed using the Odyssey Infrared Imaging System. C, rat liver ER and Golgi fractions were assayed by immunoblotting using anti-Slc35c2 peptide or anti-PDI (ER marker) or anti-GM130 (Golgi marker) or anti-Pofut1 peptide antibodies. Western blotting was performed using the Odyssey Infrared Imaging System.
FIGURE 8.
FIGURE 8.
Slc35c2 subcellular localization in IEC and HeLa cells. Expression of Slc35c2 in fixed rat IEC (A–F) or HeLa cells (G–N). Transfected Slc35c2 was detected in B, H, J, and L with anti-Slc35c2 pAb; Slc35c2-Myc was detected in D, F, and N with anti-Myc mAb. Other antibodies included anti-PDI (ER marker), anti-ERGIC-53 (ERGIC marker), anti-GM130 (cis-Golgi marker), anti-ManII (medial-Golgi marker), and anti-β4GalT1 (trans-Golgi marker). Images were taken using a Leica SP2 AOBS confocal microscope. Scale bars, 10 μm.

References

    1. Artavanis-Tsakonas S., Rand M. D., Lake R. J. (1999) Science 284, 770–776 - PubMed
    1. Kopan R., Ilagan M. X. (2009) Cell 137, 216–233 - PMC - PubMed
    1. Wang Y., Shao L., Shi S., Harris R. J., Spellman M. W., Stanley P., Haltiwanger R. S. (2001) J. Biol. Chem. 276, 40338–40345 - PubMed
    1. Shi S., Stanley P. (2003) Proc. Natl. Acad. Sci. U.S.A. 100, 5234–5239 - PMC - PubMed
    1. Okamura Y., Saga Y. (2008) Mech. Dev. 125, 663–673 - PubMed

Publication types

MeSH terms