. 2011 Jan;48(1):24-31.
doi: 10.1136/jmg.2010.080937. Epub 2010 Sep 12.

Genes that determine immunology and inflammation modify the basic defect of impaired ion conductance in cystic fibrosis epithelia

Affiliations

Genes that determine immunology and inflammation modify the basic defect of impaired ion conductance in cystic fibrosis epithelia

Frauke Stanke et al. J Med Genet. 2011 Jan.

Abstract

Background: The cystic fibrosis (CF) basic defect, caused by dysfunction of the apical chloride channel CFTR in the gastrointestinal and respiratory tract epithelia, has not been employed so far to support the role of CF modifier genes.

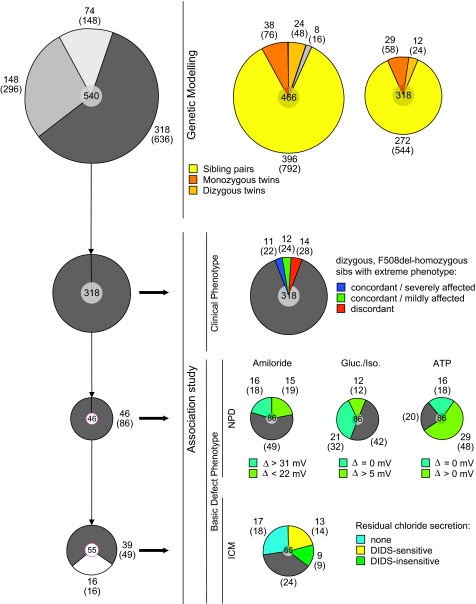
Methods: Patients were selected from 101 families with a total of 171 F508del-CFTR homozygous CF patients to identify CF modifying genes. A candidate gene based association study of 52 genes on 16 different chromosomes with a total of 182 genetic markers was performed. Differences in haplotype and/or diplotype distribution between case and reference CF subpopulations were analysed.

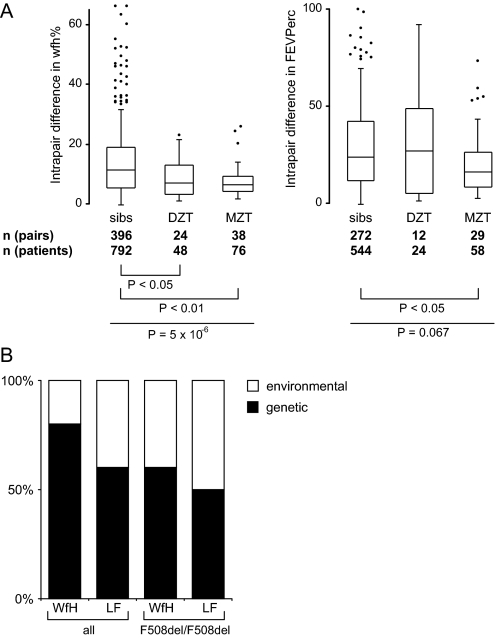
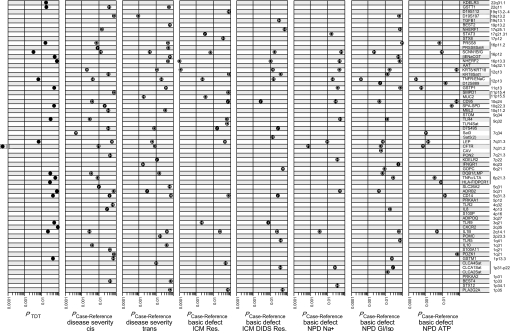
Results: Variants at immunologically relevant genes were associated with the manifestation of the CF basic defect (0.01<Praw<0.0001 at IL1B, TLR9, TNFα, CD95, STAT3 and TNFR). The intragenic background of F508del-CFTR chromosomes determined disease severity and manifestation of the basic defect (Praw=0.0009). Allele distributions comparing transmitted and non-transmitted alleles were distorted at several loci unlinked to CFTR.

Conclusions: The inherited capabilities of the innate and adaptive immune system determine the manifestation of the CF basic defect. Variants on F508del-CFTR chromosomes contribute to the observed patient-to-patient variability among F508del-CFTR homozygotes. A survivor effect, manifesting as a transmission disequilibrium at many loci, is consistent with the improvement of clinical care over the last decades, resulting in a depletion of risk alleles at modifier genes. Awareness of non-genetic factors such as improvement of patient care over time is crucial for the interpretation of CF modifier studies.


Conflict of interest statement

Competing interests: None.

Figures

Figure 1
Figure 1
Assembly of patient subsets for genetic modelling and association study. Weight, height, and lung function data of at least one out of two siblings was received in 1995–1996 for 540 cystic fibrosis (CF) sib pairs from 158 CF clinics in 14 European countries. Pairs for whom clinical data was obtained for both sibs of a pair were included into genetic modelling (466 pairs with weight and height, 318 pairs with lung function). Subsamples of F508del homozygotes were selected for the association study based on the clinical phenotype or the basic defect phenotype which was measured by nasal potential difference measurement (NPD) and intestinal current measurement (ICM). In total, 171 patients from 101 families were genotyped. Two patients with CFTR mutation genotypes other than F508del/F508del were only included for the phenotype ‘DIDS-sensitive chloride conductance’ determined by ICM. The association study compared subsets of affected patient pairs in their manifestation of the clinical phenotype, and correspondingly only dizygous pairs were included. In case of case–control comparisons of the basic defect in subsamples of unrelated index cases, one twin per monozygous twin pair was added to the cohort. For the association study on ICM phenotypes, 16 families with F508del homozygous offspring recruited from the CF clinic in Hannover, Germany were included. Integers within this figure correspond to the number of independent families while all numbers in brackets refer to the number of individual patients. Relative proportions of samples and subsamples stratified for extreme phenotypes are displayed on the basis of the number of independent nuclear families—that is, of sib pairs instead of individual patients—in order to represent sample sizes based on their number of independent genetic contributions which define the effective number of chromosomes considered for the genetic association study. Integers on top of diagrams report the sample size as the sum of all subgroups. Integers adjacent to diagrams report sizes of subgroups which are visualised as slices. For subgroups consisting of 540, 466 and 318 pairs, the entire circle diameter corresponds to the sample size. For subgroups consisting of 46 and 55 families, the sample size is represented in proportion to the larger datasets by the circle diameter carrying the sample size label (white central circle with red rim on top of the diagram). Composition of subgroups stratified for manifestation of the basic defect is displayed on the basis of individual patients. The numbers displayed for the contrasting phenotypes analysed in the case–control scenarios show the effective sample size, taking into account that sib pairs who show a discordant basic defect phenotype can contribute to one out of two (NPD phenotypes) or one out of three (ICM phenotypes) subgroups only in the association study. In other words, subsets of unrelated patients were defined by an index case strategy whereby extreme basic defect phenotypes were selected for in pairs for whom discordance ICM or NPD was observed. As NPD measurements were obtained for two siblings of a pair in most cases, two subsets for each case–control test were evaluated to provide an internal control depending on which sibling was assigned at random to be the index case. Candidate genes were interrogated for their association with disease severity using the phenotypic contrast between concordant/mildly affected patient pairs, concordant/severely affected patient pairs, and discordant patient pairs. For this purpose, 37 dizygous pairs—representing the 12% most informative patient pairs of the entire sample—were selected based on a non-parametric ranking algorithm as described previously. NPD data were used firstly to enquire for an association with sodium transport via the amiloride sensitive proportion of the potential, using the upper and lower 30% of the entire sample to define extreme phenotypes, secondly to evaluate an association with residual chloride secretion activated by chloride-free gluconate solution and isoproterenol, and thirdly to analyse a contribution of the selected candidate genes on ATP stimulated chloride response. The basic defect assessed by ICM was evaluated using a set of patients devoid of residual chloride secretion as controls. The pleiotropic chloride channel inhibitor DIDS, to which CFTR is not sensitive at the chosen concentration, was used to discriminate CFTR mediated residual chloride secretion from chloride secretion mediated by alternative channels which are DIDS sensitive.
Figure 2
Figure 2
Relative impact of environmental and inherited factors on cystic fibrosis (CF). (A) Distribution of intrapair differences in weight for height % (wfh%, left) and the CF population centiles for FEV1%pred (FEVPerc, right) among sib pairs, dizygous twins (DZT) and monozygous twins (MZT). Overall comparisons were done by Kruskal-Wallis rank test (wfh%: P=5×10⁻⁶; FEVPerc: P=0.067) and individual subgroups were compared by Dunn rank test. Please note that both monozygous and dizygous twins are similarly concordant in wfh%, indicating that the shared in utero environment determines outcome in wfh%. In contrast, monozygous twins are more concordant that either dizygous twins or sibs in FEVPerc, implying that lung function is influenced by inherited factors. (B) Relative impact of inherited and environmental factors on disease manifestation as estimated by genetic modelling. Covariance matrices of weight as % of predicted weight for height (WFH) and forced expiratory volume in 1 s as % of predicted value (LF) were analysed by genetic modelling. All patient pairs and the subgroup of F508del-CFTR homozygotes were evaluated. Models were based on a linear combination of the four following factors: random environmental effects, shared environmental effects, additive and dominant genetic effects. Goodness-of-fit was judged by χ2 measure, whereby in case of two or more models with a similar goodness-of-fit the least complicated model, based on the fewest out of the four linearly combined factors, was accepted as suggested by the Akaike information criterion. Consensus diagrams displaying the impact of inherited (black bars) and environmental (white bars) factors are shown.
Figure 3
Figure 3
Association of candidate genes with CF disease severity and basic defect. Candidate genes are listed according to their position in the human genome. Association to genes instead of results of individual markers are displayed if several linked markers were analysed per gene or gene cluster. For PRSS8, SCNN1B/SCNN1G, KRT8/KRT18, TNFR/SCNN1A, TLR4, the results of the microsatellite scan and the confirmation by low resolution single nucleotide polymorphism (SNP) typing are shown. Solid lines are used to indicate unlinked genes, adjacent loci within 10 Mb distance are separated by dotted lines and neighbouring genes are not separated by lines between gene names. All candidate genes were analysed for an underrepresentation of alleles among transmitted chromosomes (TDT) as well as by case–reference comparisons for their association with disease severity, intestinal current measurement (ICM) or nasal potential difference measurement (NPD): disease severity cis—case = concordant mildly affected patient pairs, reference = concordant severely affected patient pairs; disease severity trans—case = discordant patient pairs, reference = concordant patient pairs ; ICM_Res—case = DIDS-insensitive (CFTR-mediated) residual chloride secretion, reference = no residual chloride secretion; ICM_DIDSRes—case-DIDS-sensitive (≠CFTR) residual chloride secretion, reference = no residual chloride secretion; NPD_Na+—case = low response to amiloride, reference = high response to amiloride; NPD_Gl/Iso—case = no response to gluconate and isoproterenol, reference = residual chloride secretion response to gluconate and isoproterenol; NPD_ATP—case = no response to ATP, reference = residual chloride secretion response to ATP. Solid dots correspond to raw P values for single chromosomes (marked H), chromosome pairs (marked D) or accumulation of rare variants (marked r). All displayed values are uncorrected Praw (see also supplemental table 8).
Figure 4
Figure 4
Comparison of allele distributions among patients with different basic defect phenotypes. Allele distributions are shown for the CFTR-locus (A–C), SCNN1A, encoding the α-subunit of the epithelial sodium channel ENaC and the neighbouring gene TNFRSF1A, encoding the 55 kDa receptor for TNFα (TNFR) (D, E) and the CFTR interaction partner NHERF2 (F). Pictograms represent the relative location of targeted candidate gene (black box) and genotyped markers (vertical lines). Markers are: XV-2c, the variant HUG16RS and J3.11 (A, B); XV-2c, KM19 5' and IVS17bTA (C); four markers in SCNN1A (nt7AG, SC3, SC4 and rs2228576 (D); four markers in TNFR (rs767455, D12S889, rs1800692 and rs1800693 (E); two microsatellites near NHERF2 (F). Alleles at IVS17bTA are calibrated in accordance with Morral et al. For other microsatellites, arbitrary repeat units were assigned with 10 corresponding to the most frequently observed allele. Single nucleotide polymorphisms (SNPs) typed by polymerase chain reaction-restriction fragment length polymorphism (PCR-RFLP) are named according to the presence (allele 2) or absence (allele 1) of the diagnostic restriction site. P values and corresponding allele distributions (A–B; D–F) or diplotypes distributions (C) are given for six case–control tests. Pbest is the best observed P value while Pglobal was corrected for multiple testing of all markers at the locus. Phenotypes are: NPD_Amil: NPD change to amiloride [mV]; NPD_ATP: NPD change to ATP; NPD_GI: NPD change to gluconate and isoproterenol [mV]; ICM no Res.: no residual response; ICM Res.: cAMP sensitive and DIDS insensitive residual chloride secretion. The four-marker haplotype at TNFR correlates with cystic fibrosis (CF) disease severity whereby allele 1-10-2-2 is associated with a mild CF phenotype (E) and is also overrepresented among patients exhibiting residual chloride secretion assessed by nasal potential difference measurement (NPD) (D).

References

    1. Strausbaugh SD, Davis PB. Cystic fibrosis: a review of epidemiology and pathobiology. Clin Chest Med 2007;28:279–88 - PubMed
    1. Koch C, Cuppens H, Rainisio M, Madessani U, Harms H, Hodson M, Mastella G, Navarro J, Strandvik B, McKenzie S. Investigators of the ERCF. European Epidemiologic Registry of Cystic Fibrosis (ERCF): comparison of major disease manifestations between patients with different classes of mutations. Pediatr Pulmonol 2001;31:1–12 - PubMed
    1. Mekus F, Ballmann M, Bronsveld I, Bijman J, Veeze H, Tümmler B. Categories of deltaF508 homozygous cystic fibrosis twin and sibling pairs with distinct phenotypic characteristics. Twin Res 2000;3:277–93 - PubMed
    1. Vanscoy LL, Blackman SM, Collaco JM, Bowers A, Lai T, Naughton K, Algire M, McWilliams R, Beck S, Hoover-Fong J, Hamosh A, Cutler D, Cutting GR. Heritability of lung disease severity in cystic fibrosis. Am J Respir Crit Care Med 2007;175:1036–43 - PMC - PubMed
    1. Davis PB. Cystic fibrosis since 1938. Am J Respir Crit Care Med 2006;173:475–82 - PubMed

Publication types

MeSH terms

Substances