

A synthetic-natural hybrid oscillator in human cells
- PMID: 20837528
- PMCID: PMC2947868
- DOI: 10.1073/pnas.1005615107
A synthetic-natural hybrid oscillator in human cells
Abstract
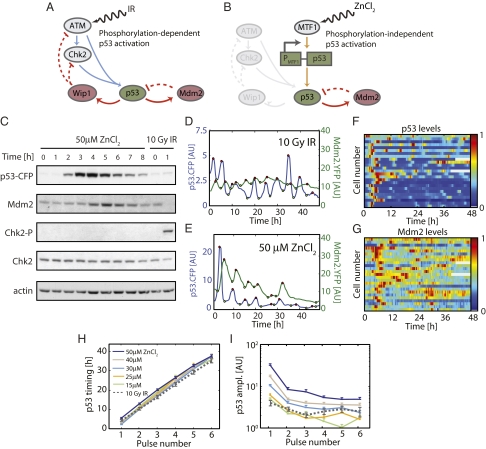
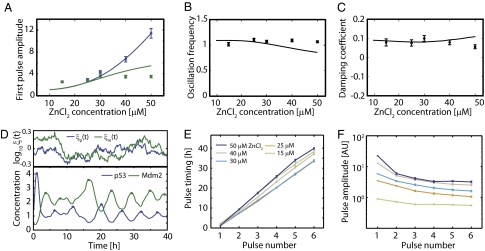
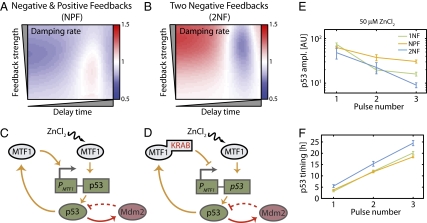
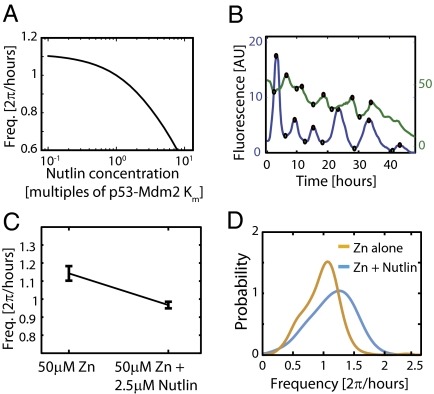
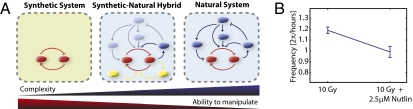
Recent studies have shown that many cell-signaling networks contain interactions and feedback loops that give rise to complex dynamics. Synthetic biology has allowed researchers to construct and analyze well-defined signaling circuits exhibiting behavior that can be predicted and quantitatively understood. Combining these approaches--wiring natural network components together with engineered interactions--has the potential to precisely modulate the dynamics of endogenous signaling processes and control the cell decisions they influence. Here, we focus on the p53 signaling pathway as a template for constructing a tunable oscillator comprised of both natural and synthetic components in mammalian cells. We find that a reduced p53 circuit implementing a single feedback loop preserves some features of the full network's dynamics, exhibiting pulses of p53 with tightly controlled timing. However, in contrast to the full natural p53 network, these pulses are damped in individual cells, with amplitude that depends on the input strength. Guided by a computational model of the reduced circuit, we constructed and analyzed circuit variants supplemented with synthetic positive and negative feedback loops and subjected to chemical perturbation. Our work demonstrates that three important features of oscillator dynamics--amplitude, period, and the rate of damping--can be controlled by manipulating stimulus level, interaction strength, and feedback topology. The approaches taken here may be useful for the rational design of synthetic networks with defined dynamics, and for identifying perturbations that control dynamics in natural biological circuits for research or therapeutic purposes.
Conflict of interest statement
The authors declare no conflict of interest.
Figures
Similar articles
-
p53-Mdm2 loop controlled by a balance of its feedback strength and effective dampening using ATM and delayed feedback.Syst Biol (Stevenage). 2005 Sep;152(3):109-18. doi: 10.1049/ip-syb:20050025. Syst Biol (Stevenage). 2005. PMID: 16986275
-
Fourier analysis and systems identification of the p53 feedback loop.Proc Natl Acad Sci U S A. 2010 Jul 27;107(30):13550-5. doi: 10.1073/pnas.1001107107. Epub 2010 Jul 9. Proc Natl Acad Sci U S A. 2010. PMID: 20622152 Free PMC article.
-
Oscillations by the p53-Mdm2 feedback loop.Adv Exp Med Biol. 2008;641:28-38. doi: 10.1007/978-0-387-09794-7_2. Adv Exp Med Biol. 2008. PMID: 18783169 Review.
-
Exploring a minimal two-component p53 model.Phys Biol. 2010 Sep 10;7(3):036008. doi: 10.1088/1478-3975/7/3/036008. Phys Biol. 2010. PMID: 20834108
-
Mathematical Modelling of p53 Signalling during DNA Damage Response: A Survey.Int J Mol Sci. 2021 Sep 30;22(19):10590. doi: 10.3390/ijms221910590. Int J Mol Sci. 2021. PMID: 34638930 Free PMC article. Review.
Cited by
-
Entrainment to periodic initiation and transition rates in a computational model for gene translation.PLoS One. 2014 May 6;9(5):e96039. doi: 10.1371/journal.pone.0096039. eCollection 2014. PLoS One. 2014. PMID: 24800863 Free PMC article.
-
Gene-circuit therapy on the horizon: synthetic biology tools for engineered therapeutics.Acta Biochim Pol. 2021 Aug 30;68(3):377-383. doi: 10.18388/abp.2020_5744. Acta Biochim Pol. 2021. PMID: 34460209 Free PMC article. Review.
-
Mammalian synthetic biology for studying the cell.J Cell Biol. 2017 Jan 2;216(1):73-82. doi: 10.1083/jcb.201611002. Epub 2016 Dec 8. J Cell Biol. 2017. PMID: 27932576 Free PMC article. Review.
-
Using computational modeling and experimental synthetic perturbations to probe biological circuits.Methods Mol Biol. 2015;1244:259-76. doi: 10.1007/978-1-4939-1878-2_12. Methods Mol Biol. 2015. PMID: 25487101 Free PMC article.
-
A simple negative interaction in the positive transcriptional feedback of a single gene is sufficient to produce reliable oscillations.PLoS One. 2011;6(11):e27414. doi: 10.1371/journal.pone.0027414. Epub 2011 Nov 10. PLoS One. 2011. PMID: 22205920 Free PMC article.
References
-
- Mitchison J. The Biology of the Cell Cycle. Cambridge: Cambridge University Press; 1971.
-
- Dunlap J, Loros J, Decoursey P. Chronobiology: Biological Timekeeping. Sunderland: Sinauer Associates; 2004.
-
- Santos SD, Verveer PJ, Bastiaens PI. Growth factor-induced MAPK network topology shapes Erk response determining PC-12 cell fate. Nat Cell Biol. 2007;9:324–330. - PubMed
-
- Alon U. Network motifs: Theory and experimental approaches. Nat Rev Genet. 2007;8:450–461. - PubMed
-
- Gardner TS, Cantor CR, Collins JJ. Construction of a genetic toggle switch in Escherichia coli. Nature. 2000;403:339–342. - PubMed
Publication types
MeSH terms
Substances
Grants and funding
LinkOut - more resources
Full Text Sources
Molecular Biology Databases
Research Materials
Miscellaneous
