. 2010 Sep 28;107(39):16806-10.
doi: 10.1073/pnas.1011699107. Epub 2010 Sep 13.

Probing electron transfer mechanisms in Shewanella oneidensis MR-1 using a nanoelectrode platform and single-cell imaging

Affiliations

Probing electron transfer mechanisms in Shewanella oneidensis MR-1 using a nanoelectrode platform and single-cell imaging

Xiaocheng Jiang et al. Proc Natl Acad Sci U S A. .

Abstract

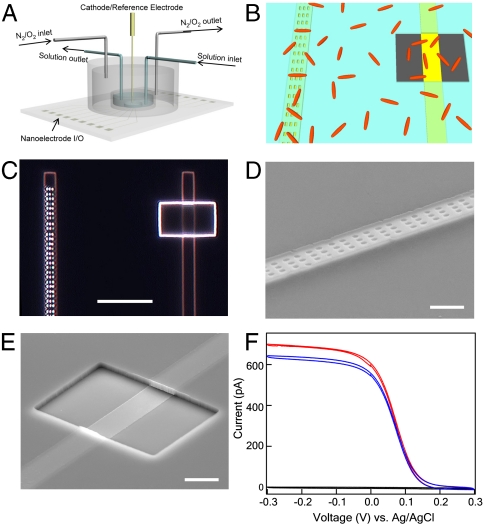
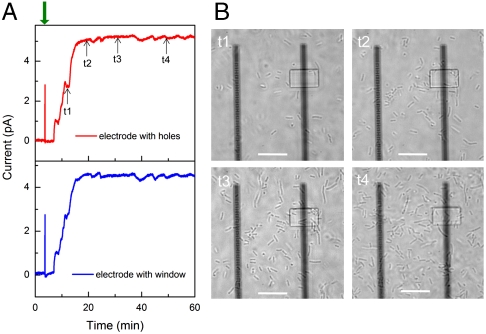
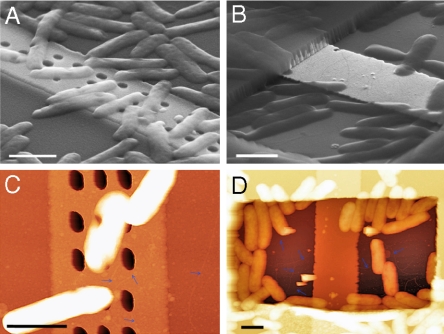
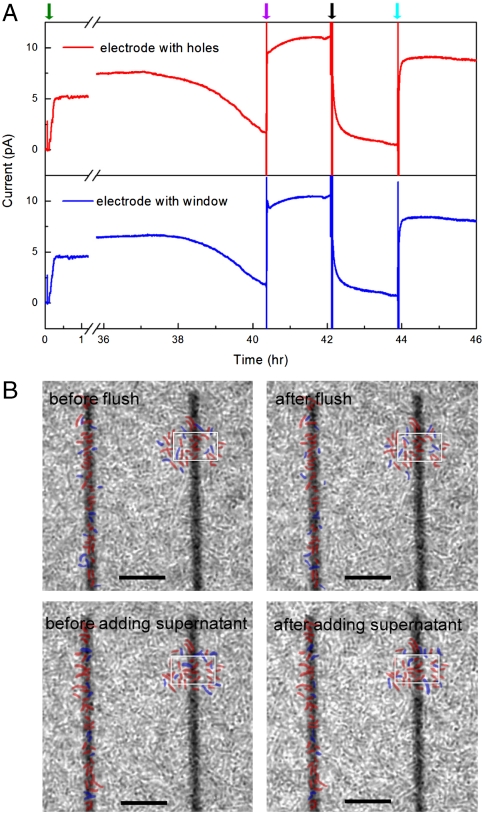
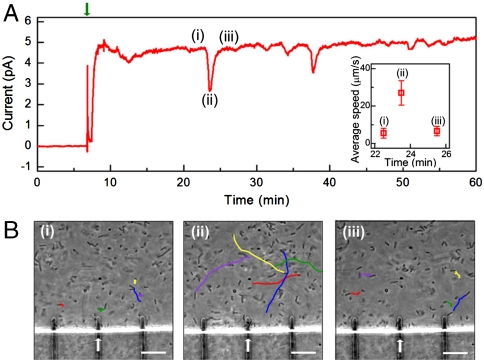
Microbial fuel cells (MFCs) represent a promising approach for sustainable energy production as they generate electricity directly from metabolism of organic substrates without the need for catalysts. However, the mechanisms of electron transfer between microbes and electrodes, which could ultimately limit power extraction, remain controversial. Here we demonstrate optically transparent nanoelectrodes as a platform to investigate extracellular electron transfer in Shewanella oneidensis MR-1, where an array of nanoholes precludes or single window allows for direct microbe-electrode contacts. Following addition of cells, short-circuit current measurements showed similar amplitude and temporal response for both electrode configurations, while in situ optical imaging demonstrates that the measured currents were uncorrelated with the cell number on the electrodes. High-resolution imaging showed the presence of thin, 4- to 5-nm diameter filaments emanating from cell bodies, although these filaments do not appear correlated with current generation. Both types of electrodes yielded similar currents at longer times in dense cell layers and exhibited a rapid drop in current upon removal of diffusible mediators. Reintroduction of the original cell-free media yielded a rapid increase in current to ∼80% of original level, whereas imaging showed that the positions of > 70% of cells remained unchanged during solution exchange. Together, these measurements show that electron transfer occurs predominantly by mediated mechanism in this model system. Last, simultaneous measurements of current and cell positions showed that cell motility and electron transfer were inversely correlated. The ability to control and image cell/electrode interactions down to the single-cell level provide a powerful approach for advancing our fundamental understanding of MFCs.


Conflict of interest statement

The authors declare no conflict of interest.

Figures

Fig. 1.
Fig. 1.
Design and characterization of nanoelectrode chip. (A) Schematic of overall experimental design. Transparent electrode array is fabricated on 0.17-mm glass slide, enabling simultaneous current recording and optical imaging of cells on electrodes. A PDMS chamber is attached and sealed to the substrate, allowing for continuous or batch solution exchange, and control of the ambient environment by tuning the ratio of pure O2 and N2 gas sources using mass flow controllers. (B) Schematic of nanoelectrode design to control microbe/electrode interaction at the single-cell level. Nanoholes or window openings are defined in the silicon nitride insulating layer (blue) deposited over electrodes (yellow) to preclude or enable direct contact with microbes (red). The nanoholes and window are designed to expose the same electrode area to solution. Device fabrication and dimension details are specified in Materials and Methods. (C) Dark-field optical image of two adjacent finger electrodes separated by 25 μm with array of nanoholes (Left) and single window (Right). Scale bar, 10 μm. (D and E) Tilted-view SEM images of individual nanohole (D) and window (E) electrode. Scale bar, 2 μm. (F) Cyclic voltammetry measurement of adjacent finger electrodes with nanoholes (red), large window (blue), and full silicon nitride passivation (black) in 1-mM ferricyanide solution.
Fig. 2.
Fig. 2.
Simultaneous current recording and optical imaging at early stage of cell landing. (A) Short-circuit current recording on electrodes with nanoholes (red) and large window (blue), respectively. Cell culture, electronics, and recording details are specified in Materials and Methods. In short, 0.5-mL cell culture was injected into measurement chamber at ∼4 min (indicated by green arrow) after recording the stable baseline. The short-circuit current was recorded at an acquisition rate of 1 Hz with reference/cathode electrode (Ag/AgCl) grounded. (B) In situ phase-contrast images of MR-1 cells on adjacent electrodes with nanoholes (Left) and window (Right). The images were captured with an inverted phase-contrast microscope at 100× magnification, at 12 (t1), 20 (t2), 30 (t3), and 50 min (t4), respectively. Scale bar, 10 μm.
Fig. 3.
Fig. 3.
Structural characterization of cell/electrode interface ∼1 h after inoculation. Cell fixation and imaging details are specified in Materials and Methods. (A and B) SEM images of MR-1 cells on electrodes with nanoholes (A) and window (B). Scale bar, 1 μm. (C and D) AFM characterization of MR-1 cells on nanohole (C) and window (D) electrodes. The blue arrows indicate the thin filaments emanating from the cell bodies. Scale bar, 1 μm.
Fig. 4.
Fig. 4.
Current and cell imaging measurements at long times with biofilm formation. (A) Long-term short-circuit current measurement on electrodes with nanoholes (red) and large window (blue), whereas the green, purple, black and cyan arrows indicate cell addition, lactate addition, flush by fresh MM, and supernatant addition, respectively. (B) Phase-contrast images of cells/electrode before, after flush and supernatant addition. Positions of cells near the nanohole (Left) and window (Right) electrodes that did not and did shift position during solution exchanges are marked in red and blue, respectively. The window is marked in white for clarity in each image; scale bars are 10 μm. Specific details of solution exchanges to/from the measurement chamber are as follows: 15 μL of 2 M sodium lactate [diluted from 60% Sodium DL-lactate solution (Sigma-Aldrich)] was directly injected into measurement chamber (containing ∼1 mL solution), leading to final lactate concentration of ∼30 mM with minimal dilution of other species. For the flush with fresh MM, the supernatant in measurement chamber was removed with a syringe, and then 1 mL nitrogen purged fresh MM (containing 30 mM lactate) was added to the chamber, where the addition of nitrogen purged fresh MM was repeated twice to ensure removal of mediators in the measurement chamber. The original supernatant, which was centrifuged at 3,000 rpm for 5 min to remove planktonic cells, was returned to the measurement chamber in the final exchange after removing the previous fresh MM by syringe. The original supernatant was diluted during solution exchange due to the incomplete removal of fresh media.
Fig. 5.
Fig. 5.
Cell motility and current generation. (A) Short-circuit current recording on electrodes with organic polymer passivation rather than silicon nitride (Figs. 2–4). Device fabrication and measurement details are specified in Materials and Methods. The green arrow indicates the cell injection. Sharp current dips were observed during early stage of cell deposition. The average cell moving speed before (i), during (ii), and after (iii) the first spike dip at ca. 22 min was calculated from in situ microscopy videos (Movies S1, S2, and S3) and plotted as Inset. (B) Tracking trajectories for selected MR-1 cells during one second for period (i), (ii), and (iii). The trajectories were plotted based on real-time phase-contrast microscopy videos of MR-1 cells (Movies S1, S2, and S3) recorded at position of electrode used to record data in (A) (marked by white arrow). Scale bar, 10 μm.

References

    1. Fredrickson JK, et al. Towards environmental systems biology of Shewanella. Nat Rev Microbiol. 2008;6:592–603. - PubMed
    1. Bond DR, Holmes DE, Tender LM, Lovley DR. Electrode-reducing microorganisms that harvest energy from marine sediments. Science. 2002;295:483–485. - PubMed
    1. Logan BE, Regan JM. Electricity-producing bacterial communities in microbial fuel cells. Trends Microbiol. 2006;14:512–518. - PubMed
    1. Lovley DR. Bug juice: Harvesting electricity with microorganisms. Nat Rev Microbiol. 2006;4:497–508. - PubMed
    1. Logan BE. Exoelectrogenic bacteria that power microbial fuel cells. Nat Rev Microbiol. 2009;7:375–381. - PubMed

Publication types

LinkOut - more resources