. 2010 Sep 27;207(10):2195-206.
doi: 10.1084/jem.20101123. Epub 2010 Sep 13.

IAP inhibitors enhance co-stimulation to promote tumor immunity

Affiliations

IAP inhibitors enhance co-stimulation to promote tumor immunity

Michael Dougan et al. J Exp Med. .

Abstract

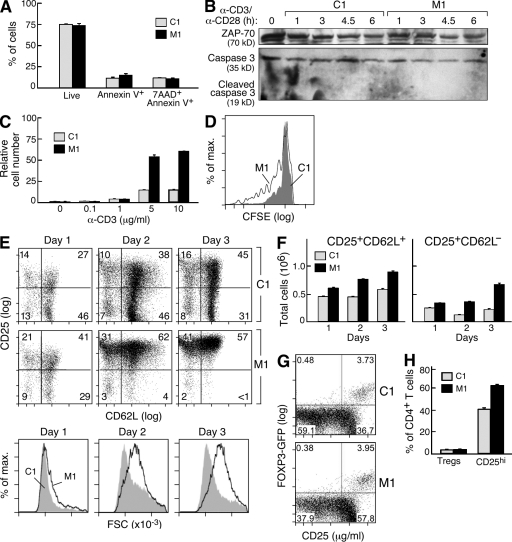
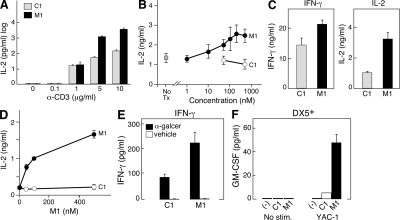
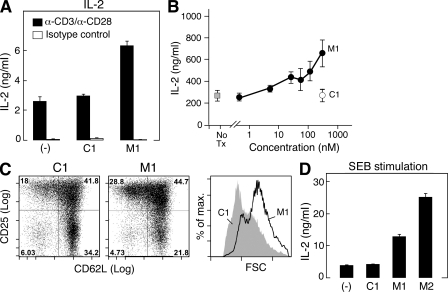
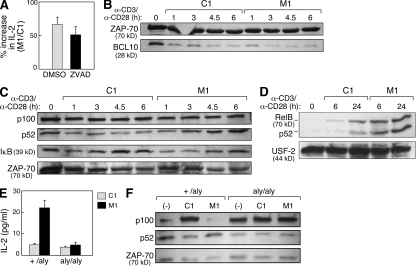
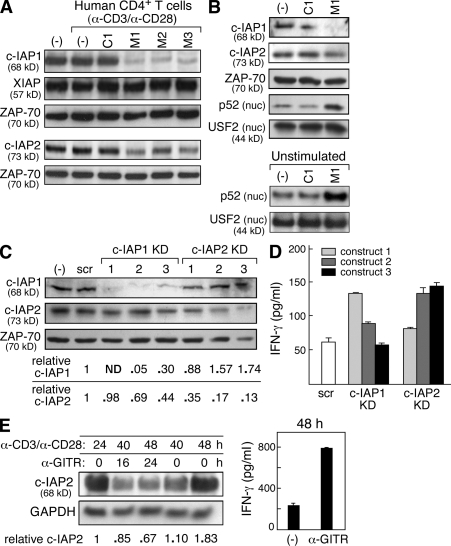
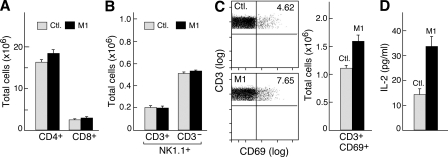
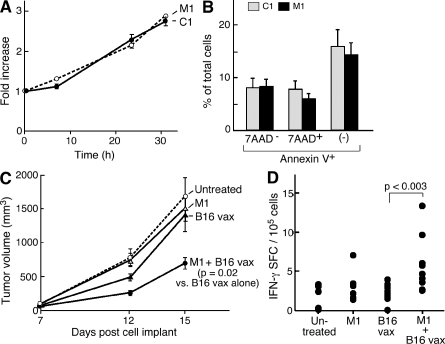
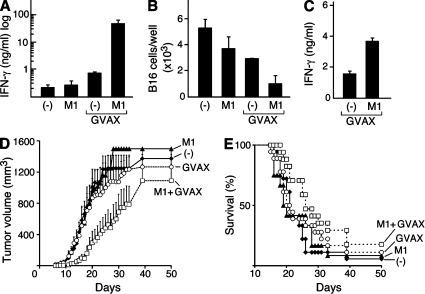
The inhibitor of apoptosis proteins (IAPs) have recently been shown to modulate nuclear factor κB (NF-κB) signaling downstream of tumor necrosis factor (TNF) family receptors, positioning them as essential survival factors in several cancer cell lines, as indicated by the cytotoxic activity of several novel small molecule IAP antagonists. In addition to roles in cancer, increasing evidence suggests that IAPs have an important function in immunity; however, the impact of IAP antagonists on antitumor immune responses is unknown. In this study, we examine the consequences of IAP antagonism on T cell function in vitro and in the context of a tumor vaccine in vivo. We find that IAP antagonists can augment human and mouse T cell responses to physiologically relevant stimuli. The activity of IAP antagonists depends on the activation of NF-κB2 signaling, a mechanism paralleling that responsible for the cytotoxic activity in cancer cells. We further show that IAP antagonists can augment both prophylactic and therapeutic antitumor vaccines in vivo. These findings indicate an important role for the IAPs in regulating T cell-dependent responses and suggest that targeting IAPs using small molecule antagonists may be a strategy for developing novel immunomodulating therapies against cancer.


Figures

Figure 1.
Figure 1.
IAP antagonists enhance mouse T cell proliferation and activation. (A–H) CD4+ T cells were positively selected from mouse spleens using magnetic beads and stimulated with 10 µg/ml plate-bound anti-CD3 (or as indicated) and 2 µg/ml anti-CD28 in the presence of IAP antagonist (M1) or control compound (C1) at 500 nM. (A) 5 × 10⁵ CD4+ T cells were stimulated for 24 h. Annexin V and 7AAD staining were determined by flow cytometry. (B) Immunoblots for ZAP-70 and caspase 3 on total cell lysates from CD4+ T cells stimulated as indicated. (C and D) 105 CD4+ T cells were stimulated as indicated. (C) After 72 h, relative cell numbers were determined using CellTiter-Glo luminescent cell viability assay (Promega) and normalized to unstimulated cultures treated with C1. (D) Cells were labeled with CFSE before stimulation, and fluorescence was measured after 72 h by flow cytometry. (E) 5 × 10⁵ CD4+ T cells were stimulated for the indicated periods of time, and CD25, CD62L, and forward scatter (FSC) were determined by flow cytometry. (F) Quantification of E using cell numbers determined by trypan blue exclusion. (G and H) 105 CD4+ T cells were isolated from the spleens of FOXP3-GFP knockin mice and stimulated for 72 h; CD25 and GFP were measured by flow cytometry. (H) Quantification of G using three replicates per group. (A–H) Error bars represent SEM. Results are representative of at least two independent experiments.
Figure 2.
Figure 2.
IAP antagonists enhance the stimulation of multiple immune effectors. (A–C) CD4+ or CD8+ T cells were isolated as in Fig. 1. (A) 105 CD4+ T cells were isolated and stimulated with anti-CD3 as indicated and 2 µg/ml anti-CD28 for 72 h. M1 and C1 were used at 500 nM. (B) 105 CD4+ T cells were isolated and stimulated with 10 µg/ml anti-CD3 and 2 µg/ml anti-CD28 for 48 h in the presence of M1 or control compound at the indicated concentrations. (C) 105 CD8+ T cells were isolated and stimulated as in B for 48 h. M1 and C1 were used at 500 nM. (D) 105 lymph node cells from RAG-deficient OTI transgenic mice were stimulated for 72 h by 0.5% formaldehyde-fixed bone marrow–derived DCs that had been pulsed with 10 µM/ml OVA peptide (SIINFEKL) 4 h before fixation. M1 or a control compound was added to the media at the indicated concentrations. (E) 5 × 10⁵ spleen cells were stimulated with 100 ng/ml α-galactosylceramide (α-galcer) or vehicle in the presence of M1 or control compound at 500 nM for 24 h. (F) 2 × 105 DX5+ NK cells were positively selected from mouse spleens using magnetic beads and stimulated for 48 h by co-culture with 4 × 10⁴ YAC-1 cells in the presence of M1 or control compound at 500 nM. (A–F) Cytokines were measured by ELISA. Error bars represent SEM. Results are representative of at least two independent experiments.
Figure 3.
Figure 3.
Human T cells respond to IAP antagonists. (A–C) 105 human CD4+ T cells were isolated from the peripheral blood by positive selection using magnetic beads and stimulated with agonistic antibodies to 10 µg/ml anti-CD3 and 2 µg/ml anti-CD28 in the presence of M1 or a control compound at 500 nM (A and C) or as indicated (B). (A and B) IL-2 was measured after 48 h in the culture supernatant by ELISA. (C) Cells were stimulated for 72 h, and CD25, CD62L, and forward scatter (FSC) were measured by flow cytometry. (D) 2 × 10⁵ human PBMCs were incubated with SEB for 96 h in the presence of 500 nM M1 or control compound. (A–D) Error bars represent SEM. Results are representative of at least three independent experiments.
Figure 4.
Figure 4.
IAP antagonists enhance T cell activation through the induction of alternative NF-κB signaling. (A–F) Mouse CD4+ T cells were isolated as in Fig. 1 or as indicated and stimulated with 10 µg/ml anti-CD3 and 2 µg/ml anti-CD28 in the presence of M1 or control compound at 500 nM. (A) CD4+ T cells were isolated and stimulated in the presence of the caspase inhibitor ZVAD-fmk or vehicle (DMSO). Data are presented as the ratio of IL-2 production measured in culture supernatants from M1-treated cells compared with control treatment. (B) Immunoblot for BCL10 in total cell lysates from stimulated CD4+ T cells. Lysates are identical to those depicted in Fig. 1 B. (C and D) Immunoblots using the indicated antibodies on total cell lysates (C) or purified nuclear lysates (D) from stimulated CD4+ T cells. (E) 105 naive T cells isolated from +/aly or aly/aly mouse spleens as depicted in Fig. S6 and stimulated in the presence of M1 or control compound. IL-2 was measured by ELISA. (A and E) Error bars represent SEM. (F) Immunoblots using the indicated antibodies on cell lysates from total +/aly or aly/aly CD4+ T cells isolated using magnetic beads and immediately lysed (−) or lysed after 24 h of stimulation (C1 and M1). (A–F) Results represent at least two independent experiments.
Figure 5.
Figure 5.
IAP antagonists target cIAP-1 and cIAP-2 in human T cells. (A and B) Immunoblots using the indicated antibodies on lysates from human CD4+ T cells isolated using magnetic beads. (A) Total lysates from CD4+ T cells were stimulated with 10 µg/ml anti-CD3 and 2 µg/ml anti-CD28 and exposed to IAP antagonists (M1, M2, and M3), a control compound (C1), or vehicle (−) for 2 h. All compounds were used at 500 nM. (B) Total cell lysates or nuclear (nuc.) lysates from human CD4+ T cells. Cells were either stimulated as in A (top) or left unstimulated (bottom) for 24 h in the presence of vehicle, M1, or control compound, which were used at 500 nM. (C and D) Human CD4+ T cells were isolated and stably transfected with lentiviral vectors encoding short hairpin RNAs against cIAP-1, cIAP-2, or nontargeting control (scramble [scr]). Three constructs (KD1–KD3) were used per gene. (C) Immunoblot using the indicated antibodies on lysates from primary CD4+ T cells expressing the indicated short hairpin RNA constructs; quantification of knockdown is included below. (D) 2 × 10⁴ cells were stimulated for 72 h. 20 U/ml recombinant human IL-2 was added to all cultures. (E, left) Immunoblot using the indicated antibodies on total lysates from human CD4+ T cells stimulated with anti-CD3/CD28; after 24 h, cells were exposed to 5 µg/ml anti-GITR antibodies as indicated. (right) IFN-γ production from GITR-stimulated cells. (A–E) Cytokines were measured by ELISA. Error bars represent SEM. Results are representative of at least two independent experiments.
Figure 6.
Figure 6.
Systemic delivery of IAP antagonists is well tolerated and leads to T cell hyperresponsiveness. (A–D) Mice were administered 750 µg M1 daily for 1 wk by gastric lavage. Spleen cells were harvested and analyzed by flow cytometry using the indicated markers. Six animals were used per group. (A) Comparison of total CD4+ and CD8+ T cells in mice treated with M1 or control (Ctl.) compound. (B) Quantification of NK1.1/CD3 staining on spleen cells from M1-treated mice. (C, left) Flow cytometry plots showing CD69+CD3+ T cells in M1-treated and control animals. (right) Quantification of CD69/CD3 staining from the left panel. (D) 105 CD4+ T cells were isolated from mice treated with M1 and stimulated with anti-CD3/CD28 for 48 h. Labels refer to the treatment conditions of the mouse from which T cells were isolated for analysis; IL-2 was measured by ELISA. (A–D) Error bars represent SEM. Results are representative of two independent experiments.
Figure 7.
Figure 7.
IAP antagonists augment a prophylactic antitumor vaccine. (A) 104 B16 cells were plated in the presence of IAP antagonists or control compound. Fold increase was determined using CellTiter-Glo relative to time 0. (B) B16 cells were irradiated with 3.5 krad and cultured for 24 h in the presence of IAP antagonists or control compound. Apoptosis was assessed by flow cytometry using annexin V and 7AAD staining. Results are representative of at least two independent experiments. (C) Tumor growth curves for C57BL/6 mice injected with 5 × 10⁵ B16 melanoma cells on day 0. Mice either did not receive a vaccine or received vaccines comprising 150 mg/kg M1, 5 × 10⁵ irradiated B16 cells, or 150 mg/kg M1 and irradiated B16 cells before tumor challenge. Eight mice were used per group. Data are consistent with two independent experiments using several distinct schedules and doses. (A–C) Error bars represent SEM. (D) On day 14, 2.5 × 10⁵ CD8+ T cells were isolated from the spleens of mice vaccinated as indicated and stimulated by irradiated spleen cells pulsed with TRP-2 peptide or vehicle. IFN-γ–reactive cells were determined by the enzyme-linked immunosorbent spot.
Figure 8.
Figure 8.
IAP antagonists enhance immune responses to a therapeutic antitumor vaccine. (A–C) On day 0, mice were vaccinated with irradiated B16 cells engineered to secrete GM-CSF (GVAX) and were either left untreated or were given a 6-d course of 1,000 µg/day M1 by gastric lavage (GVAX M1). Untreated mice (−) and mice given M1 in the absence of GVAX (M1) were used as controls. (A and B) Vaccination site draining lymph nodes were harvested on day 7 and resuspended in 500 µl RPMI containing 10 U/ml recombinant human IL-2. Lymph node cells were incubated with 2 × 10⁵ irradiated B16 cells for 4 d. (A) IFN-γ was measured in the culture supernatants by ELISA. (B) Total viable B16 cells were quantified by trypan blue exclusion. (C) 2 wk after vaccination, NK cells were isolated, activated, and analyzed as in Fig. 2 F. (A–C) Results are representative of at least two independent experiments with three to four mice per group. (D and E) On day 0, mice were challenged with 2 × 10⁵ B16 cells. Mice were vaccinated as in A–C starting on day 1. Tumor growth (D) and survival (E) for mice after challenge are shown. Results represent the combination of three similarly designed, independent experiments with similar results for a total of 12–18 mice per group. (A–E) Error bars represent SEM.

Comment in

  • Immunology: In need of a boost?
    McCarthy N. McCarthy N. Nat Rev Cancer. 2010 Nov;10(11):742. doi: 10.1038/nrc2949. Nat Rev Cancer. 2010. PMID: 21080594 No abstract available.

References

    1. Bauler L.D., Duckett C.S., O’Riordan M.X. 2008. XIAP regulates cytosol-specific innate immunity to Listeria infection. PLoS Pathog. 4:e1000142. - PMC - PubMed
    1. Bertrand M.J., Milutinovic S., Dickson K.M., Ho W.C., Boudreault A., Durkin J., Gillard J.W., Jaquith J.B., Morris S.J., Barker P.A. 2008. cIAP1 and cIAP2 facilitate cancer cell survival by functioning as E3 ligases that promote RIP1 ubiquitination. Mol. Cell. 30:689–700 10.1016/j.molcel.2008.05.014 - DOI - PubMed
    1. Bertrand M.J., Doiron K., Labbé K., Korneluk R.G., Barker P.A., Saleh M. 2009. Cellular inhibitors of apoptosis cIAP1 and cIAP2 are required for innate immunity signaling by the pattern recognition receptors NOD1 and NOD2. Immunity. 30:789–801 10.1016/j.immuni.2009.04.011 - DOI - PubMed
    1. Bidère N., Su H.C., Lenardo M.J. 2006. Genetic disorders of programmed cell death in the immune system. Annu. Rev. Immunol. 24:321–352 10.1146/annurev.immunol.24.021605.090513 - DOI - PubMed
    1. Conte D., Holcik M., Lefebvre C.A., Lacasse E., Picketts D.J., Wright K.E., Korneluk R.G. 2006. Inhibitor of apoptosis protein cIAP2 is essential for lipopolysaccharide-induced macrophage survival. Mol. Cell. Biol. 26:699–708 10.1128/MCB.26.2.699-708.2006 - DOI - PMC - PubMed

Publication types

MeSH terms