

Role of ferroportin in macrophage-mediated immunity
- PMID: 20837712
- PMCID: PMC2981308
- DOI: 10.1128/IAI.00498-10
Role of ferroportin in macrophage-mediated immunity
Abstract
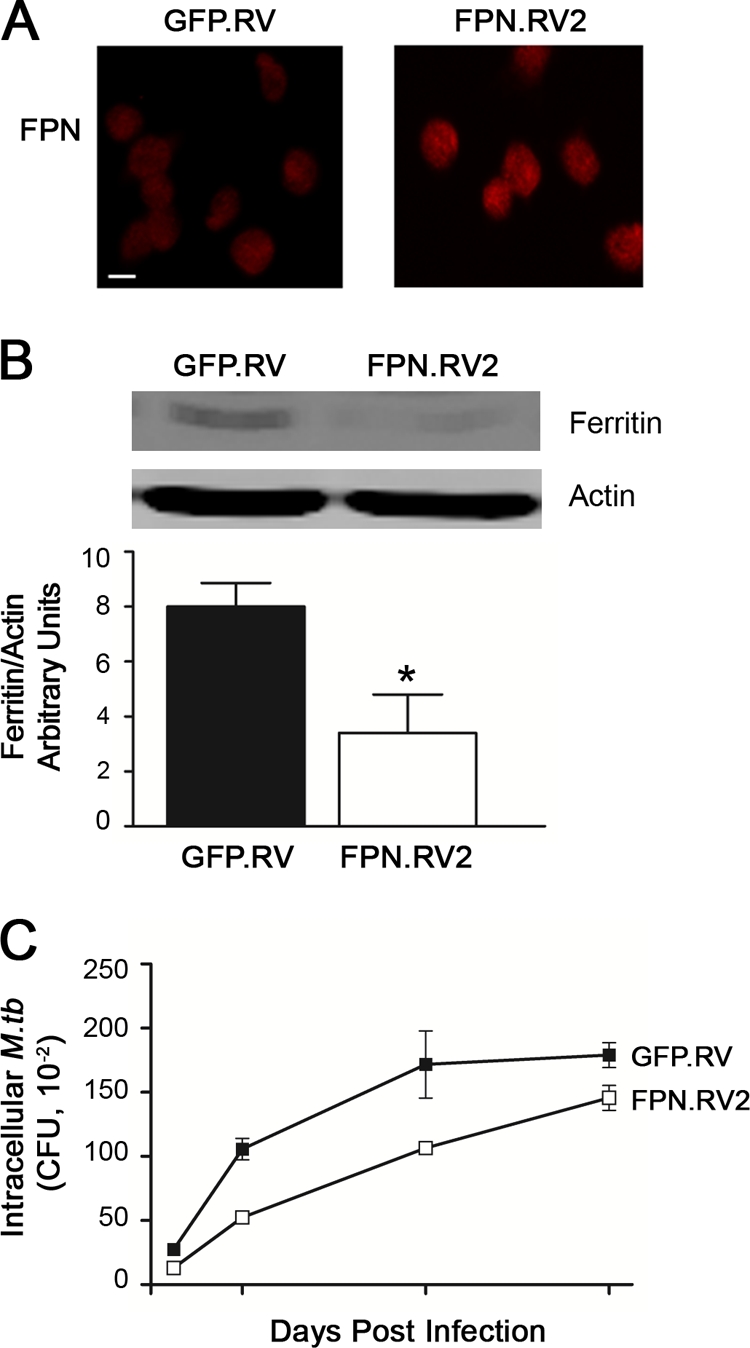
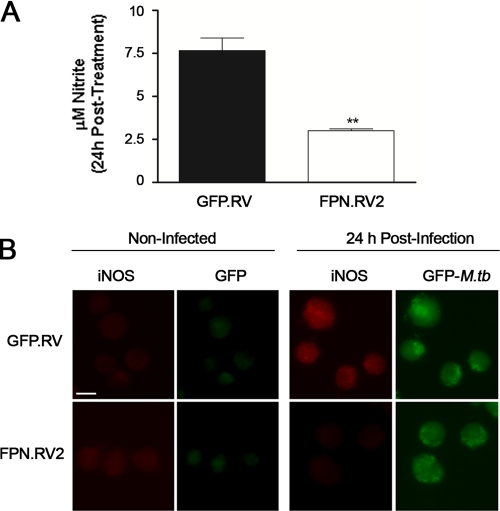
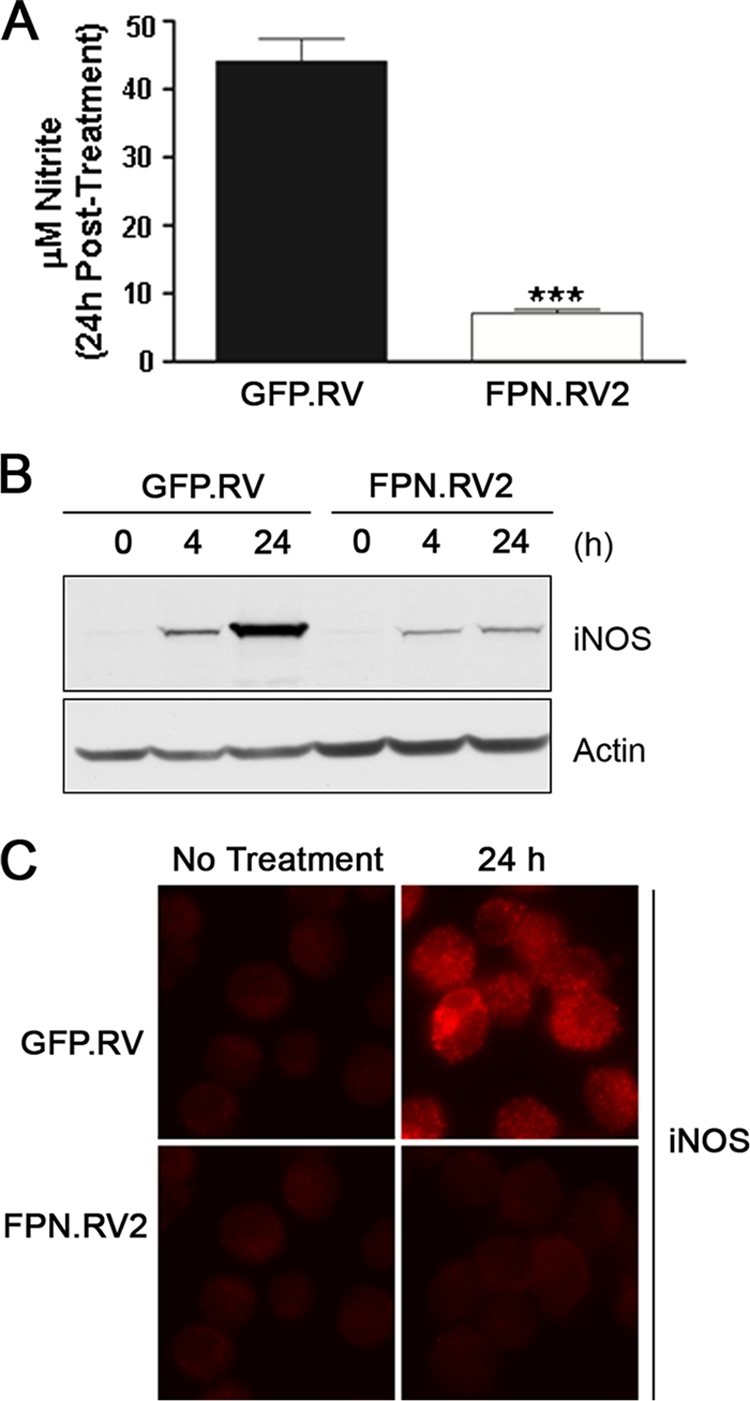
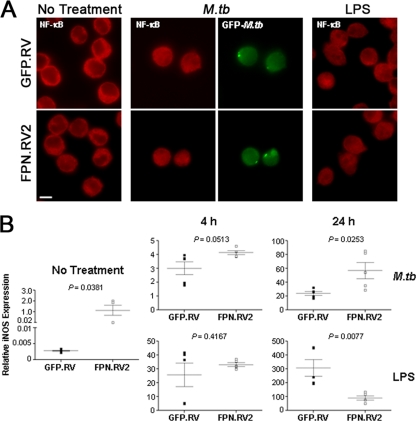
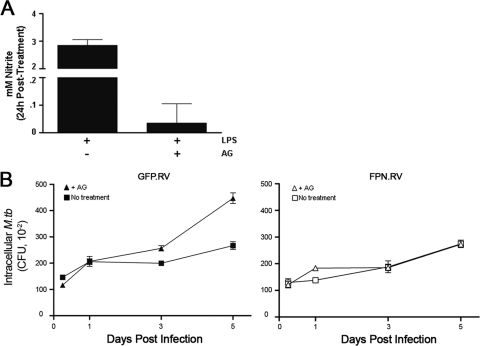
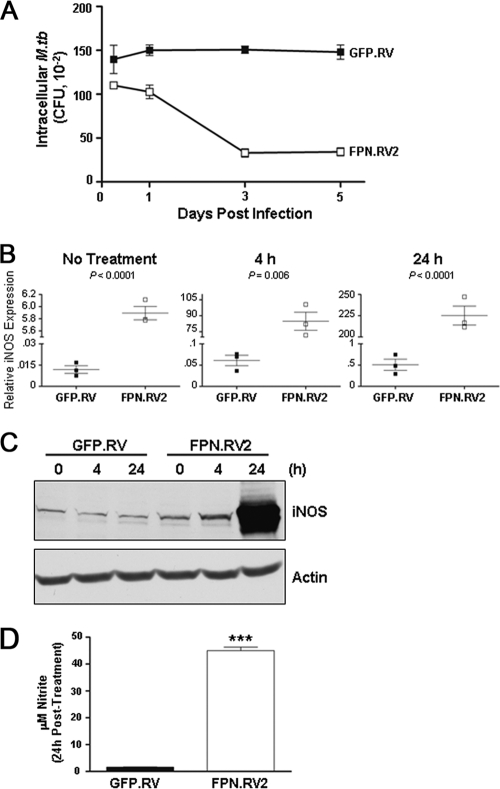
Perturbations in iron metabolism have been shown to dramatically impact host response to infection. The most common inherited iron overload disorder results from defects in the HFE gene product, a major histocompatibility complex class I-like protein that interacts with transferrin receptors. HFE-associated hemochromatosis is characterized by abnormally high levels of the iron efflux protein ferroportin. In this study, J774 murine macrophages overexpressing ferroportin were used to investigate the influence of iron metabolism on the release of nitric oxide (NO) in response to infection. Overexpression of ferroportin significantly impaired intracellular Mycobacterium tuberculosis growth during early stages of infection. When challenged with lipopolysaccharide (LPS) or M. tuberculosis infection, control macrophages increased NO synthesis, but macrophages overexpressing ferroportin had significantly impaired NO production in response to LPS or M. tuberculosis. Increased NO synthesis in control cells was accompanied by increased iNOS mRNA and protein, while upregulation of iNOS protein was markedly reduced when J744 cells overexpressing ferroportin were challenged with LPS or M. tuberculosis, thus limiting the bactericidal activity of these macrophages. The proinflammatory cytokine gamma interferon reversed the inhibitory effect of ferroportin overexpression on NO production. These results suggest a novel role for ferroportin in attenuating macrophage-mediated immune responses.
Figures
Similar articles
-
The iron export protein ferroportin 1 is differentially expressed in mouse macrophage populations and is present in the mycobacterial-containing phagosome.J Leukoc Biol. 2008 Sep;84(3):689-700. doi: 10.1189/jlb.1107781. Epub 2008 Jun 27. J Leukoc Biol. 2008. PMID: 18586980 Free PMC article.
-
Attenuated inflammatory responses in hemochromatosis reveal a role for iron in the regulation of macrophage cytokine translation.J Immunol. 2008 Aug 15;181(4):2723-31. doi: 10.4049/jimmunol.181.4.2723. J Immunol. 2008. PMID: 18684963 Free PMC article.
-
Nitric Oxide Modulates Macrophage Responses to Mycobacterium tuberculosis Infection through Activation of HIF-1α and Repression of NF-κB.J Immunol. 2017 Sep 1;199(5):1805-1816. doi: 10.4049/jimmunol.1700515. Epub 2017 Jul 28. J Immunol. 2017. PMID: 28754681 Free PMC article.
-
Iron metabolism and the innate immune response to infection.Microbes Infect. 2012 Mar;14(3):207-16. doi: 10.1016/j.micinf.2011.10.001. Epub 2011 Oct 20. Microbes Infect. 2012. PMID: 22033148 Free PMC article. Review.
-
The effect of the host's iron status on tuberculosis.J Infect Dis. 2007 Jun 15;195(12):1745-53. doi: 10.1086/518040. Epub 2007 May 4. J Infect Dis. 2007. PMID: 17492589 Review.
Cited by
-
Hepcidin mediated iron homoeostasis as immune regulator in visceral leishmaniasis patients.Parasite Immunol. 2019 Jan;41(1):e12601. doi: 10.1111/pim.12601. Epub 2018 Dec 3. Parasite Immunol. 2019. PMID: 30402883 Free PMC article.
-
Nitric oxide-mediated regulation of ferroportin-1 controls macrophage iron homeostasis and immune function in Salmonella infection.J Exp Med. 2013 May 6;210(5):855-73. doi: 10.1084/jem.20121946. Epub 2013 Apr 29. J Exp Med. 2013. PMID: 23630227 Free PMC article.
-
Macrophage defense mechanisms against intracellular bacteria.Immunol Rev. 2015 Mar;264(1):182-203. doi: 10.1111/imr.12266. Immunol Rev. 2015. PMID: 25703560 Free PMC article. Review.
-
Iron Regulation in Elderly Asian Elephants (Elephas maximus) Chronically Infected With Mycobacterium tuberculosis.Front Vet Sci. 2020 Oct 30;7:596379. doi: 10.3389/fvets.2020.596379. eCollection 2020. Front Vet Sci. 2020. PMID: 33195633 Free PMC article.
-
Rapid removal of phagosomal ferroportin in macrophages contributes to nutritional immunity.Blood Adv. 2021 Jan 26;5(2):459-474. doi: 10.1182/bloodadvances.2020002833. Blood Adv. 2021. PMID: 33496744 Free PMC article.
References
-
- Abboud, S., and D. J. Haile. 2000. A novel mammalian iron-regulated protein involved in intracellular iron metabolism. J. Biol. Chem. 275:19906-19912. - PubMed
-
- Aktan, F. 2004. iNOS-mediated nitric oxide production and its regulation. Life Sci. 75:639-653. - PubMed
-
- Andrews, N. C., and P. J. Schmidt. 2007. Iron homeostasis. Annu. Rev. Physiol. 69:69-85. - PubMed
-
- Bekker, L. G., S. Freeman, P. J. Murray, B. Ryffel, and G. Kaplan. 2001. TNF-alpha controls intracellular mycobacterial growth by both inducible nitric oxide synthase-dependent and inducible nitric oxide synthase-independent pathways. J. Immunol. 166:6728-6734. - PubMed
Publication types
MeSH terms
Substances
Grants and funding
LinkOut - more resources
Full Text Sources
Medical
