. 2010 Sep 20;190(6):1093-106.
doi: 10.1083/jcb.201002111. Epub 2010 Sep 13.

Fra-2/AP-1 controls bone formation by regulating osteoblast differentiation and collagen production

Affiliations

Fra-2/AP-1 controls bone formation by regulating osteoblast differentiation and collagen production

Aline Bozec et al. J Cell Biol. .

Abstract

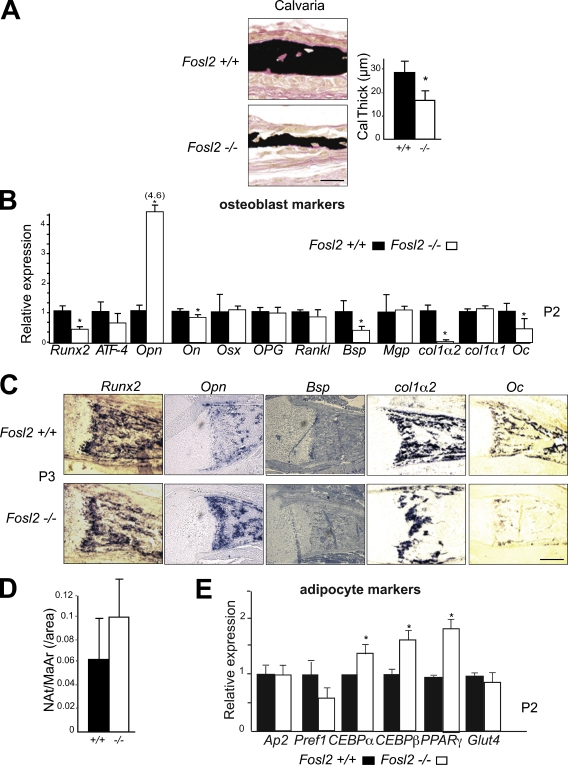
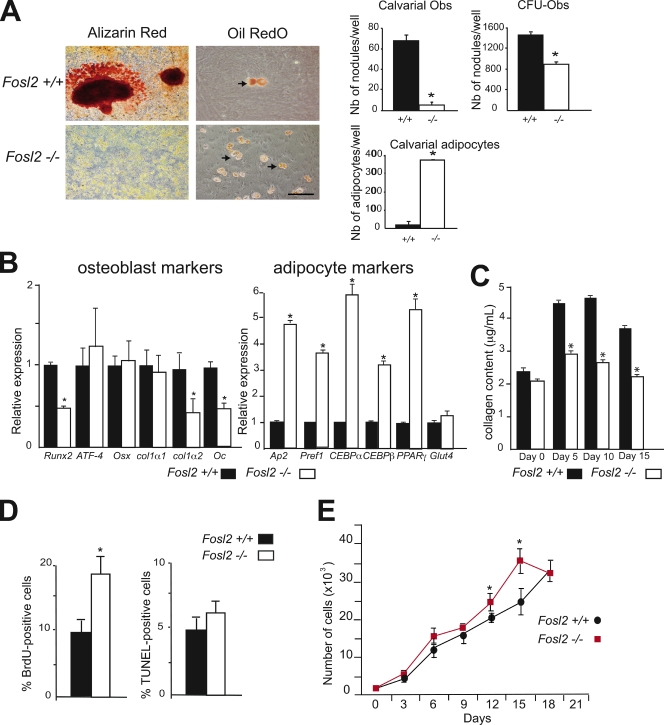
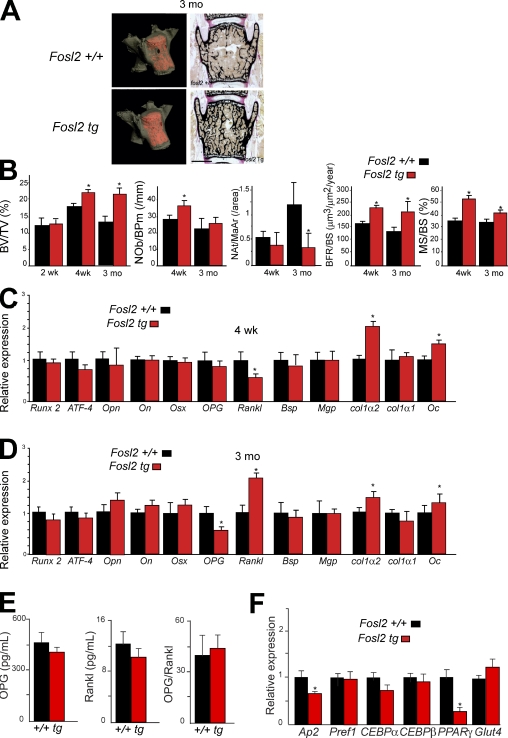
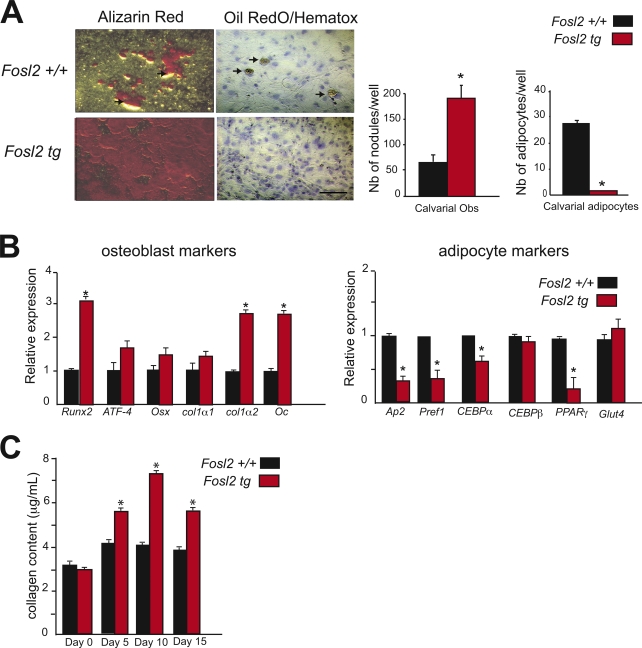
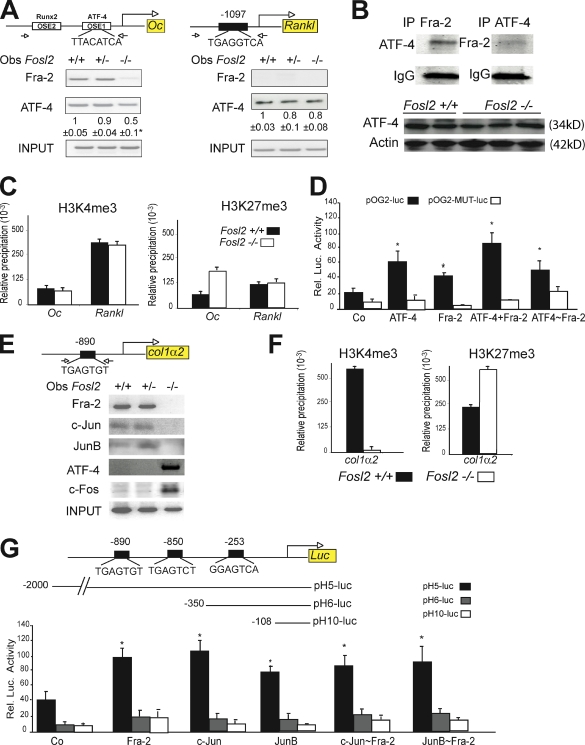
The activator protein-1 (AP-1) transcription factor complex, in particular the Fos proteins, is an important regulator of bone homeostasis. Fra-2 (Fosl2), a Fos-related protein of the AP-1 family, is expressed in bone cells, and newborn mice lacking Fra-2 exhibit defects in chondrocytes and osteoclasts. Here we show that Fra-2-deficient osteoblasts display a differentiation defect both in vivo and in vitro. Moreover, Fra-2-overexpressing mice are osteosclerotic because of increased differentiation of osteoblasts, which appears to be cell autonomous. Importantly, the osteoblast-specific osteocalcin (Oc) gene and collagen1α2 (col1α2) are transcriptional targets of Fra-2 in both murine and human bone cells. In addition, Fra-2, Oc, and col1 are expressed in stromal cells of human chondroblastic and osteoblastic osteosarcomas (Os's) as well as during osteoblast differentiation of human Os cell lines. These findings reveal a novel function of Fra-2/AP-1 as a positive regulator of bone and matrix formation in mice and humans.


Figures

Figure 1.
Figure 1.
Fosl2 ko pups exhibit an osteopenic phenotype. (A) Von Kossa staining of calvaria at P3. Quantification of bone volume calvaria thickness (P3; Fosl2+/+, n = 7; Fosl2−/−, n = 6). (B) qPCR analyses of Runx2, ATF-4, osteopontin (Opn), osteonectin (On), osterix (Osx), osteoprotegerin (OPG), receptor activator of NF-κB ligand (Rankl), bone sialoprotein (Bsp), matrix gla-protein (Mgp), collagen 1α2 (col1α2), collagen 1α1 (col1α1), and osteocalcin (Oc) in Fosl2+/+ and Fosl2−/− total long bone mRNA at P2. 4.6 represents the relative expression of Opn in Fosl2−/− long bone. (C) In situ hybridization for Runx2, Opn, Bsp, col1α2, and Oc on P2 long bones. (D) Quantification of adipocyte numbers (Nat/MaAr) in Fosl2+/+ and Fosl2−/− total long bones (P3; Fosl2+/+, n = 7; Fosl2−/−, n = 6). (E) qPCR analyses of Adipocyte protein (Ap-2), preadipocyte factor 1 (Pref1), CCAAT/enhancer binding protein-α (CEBP-α), CCAAT/enhancer binding protein-β (CEBP-β), peroxisome proliferator-activated receptor-γ (PPAR-γ), and glucose transporter 4 (Glut4) in Fosl2+/+ and Fosl2−/− total long bone mRNA at P2. Error bars represent mean values ± SD, and wt is set to *, P < 0.01; Fosl2+/+, n = 4 and Fosl2−/−, n = 6. Bars, 500 µm.
Figure 2.
Figure 2.
Osteoblast differentiation of Fosl2 ko cells in vitro. (A) Alizarin red and Oil red O/hematoxylin staining of calvaria-derived osteoblasts isolated from Fosl2+/+ and Fosl2−/− pups. Cells were cultured for 15 d on plastic in the presence of β-glycerophosphate and ascorbic acid. Quantification of the number of nodules and adipocytes per well is shown. Arrows indicate adipocytes. Bars, 200 µm. (B) qPCR analyses of osteoblast markers (Runx2, ATF-4, osterix [Osx], collagen 1α1 [col1α1], collagen 1α2 [col1α2], and osteocalcin [Oc]) and adipocyte markers (Ap2, Pref1, CEBP-α, CEBP-β, PPAR-γ, and Glut4 in Fosl2+/+ and Fosl2−/− cells at day 15 of differentiation; n = 3). Values are presented as relative expression, and wt is set to 1. (C) Collagen content in Fosl2+/+ and Fosl2−/− osteoblast–conditioned medium at day 0, 5, 10, and 15 of differentiation (n = 3). (D) BrdU incorporation and TUNEL-positive cells of calvaria-derived osteoblasts isolated from Fosl2+/+ and Fosl2−/− pups. (E) Cumulative cell number (proliferation) of Fosl2+/+ and Fosl2−/− osteoblasts. *, P < 0.01; n = 3. Error bars represent mean values ± SD.
Figure 3.
Figure 3.
Fosl2 tg mice are osteosclerotic. (A) Micro-CT and von Kossa staining of spines at 3 mo. Bar, 500 µm. (B) Quantification of bone volume (BV/TV), osteoblast number (Nob/BPm), adipocyte number (Nat/MaAr), bone formation rate (BFR/BS), and bone surface (MS/BS) at 2 wk (n = 4), 4 wk (n = 6/8), and 3 mo (n = 5/8). (C and D) qPCR analyses of Runx2, ATF-4, osteopontin (Opn), osteonectin (On), osterix (Osx), osteoprotegerin (OPG), receptor activator of NF-κB ligand (Rankl), bone sialoprotein (Bsp), matrix gla-protein (Mgp), collagen 1α2 (col1α2), collagen 1α1 (col1α1), and osteocalcin (Oc) in Fosl2+/+ and Fosl2 tg total long bone mRNA at 4 wk (C) and 3 mo (D). wt is set to 1. *, P < 0.01; n = 5. (E) OPG and Rankl levels in sera from Fosl2 wt and tg mice at 3 mo of age (n = 7). The ratio between OPG and Rankl is shown in the third graph. (F) qPCR analyses of Adipocyte protein (Ap-2), preadipocyte factor 1 (Pref1), CCAAT/enhancer binding protein-α (CEBP-α), CCAAT/enhancer binding protein-β (CEBP-β), peroxisome proliferator-activated receptor-γ (PPAR-γ), and glucose transporter 4 (Glut4) in Fosl2+/+ and Fosl2 tg total long bone mRNA at 3 mo of age. Error bars represent mean values ± SD, and wt is set to *, P < 0.01; n = 6.
Figure 4.
Figure 4.
Osteoblast differentiation of Fosl2 tg cells in vitro. (A) Alizarin red and Oil red O/hematoxylin staining of calvaria-derived osteoblast isolated from Fosl2+/+ and Fosl2 tg pups. Cells were cultured for 15 d on plastic in the presence of β-glycerophosphate and ascorbic acid. Quantification of the number of nodules and adipocytes per well is shown. Arrows indicate adipocytes. n = 3. Bar, 200 µm. (B) qPCR analyses of Runx2, ATF-4, osterix (Osx), collagen 1α1 (col1α1), collagen 1α2 (col1α2), and osteocalcin (Oc) in Fosl2+/+ and Fosl2 tg cells at day 15 of differentiation (n = 3). Values are presented as relative expression, and wt is set to 1. (C) Collagen content in Fosl2+/+ and Fosl2 tg osteoblast–conditioned medium at day 0, 5, 10, and 15 of differentiation (n = 3). Error bars represent mean values ± SD. *, P < 0.01.
Figure 5.
Figure 5.
Oc and col1α2 are transcriptional target genes of Fra-2. (A) ChIP for Oc and Rankl promoter. Arrows indicate primers amplifying fragments. Chromatin of the indicated genotypes was immunoprecipitated with AP-1 antibodies. Quantification and endpoint qPCR-amplified fragments at 200 bp are shown. *, P < 0.01. (B) Coimmunoprecipitation for Fra-2 and ATF-4 in primary wt osteoblasts. IgG is used for loading control. Western blot analyses for 38 kD ATF-4 in Fosl2+/+ (n = 2) and Fosl2−/− (n = 3) long bones at P2. 42 kD actin is used as loading control. (C) H3K4me3 and H3K27me3 ChIP on Oc and Rankl promoter. Chromatin from osteoblasts of the indicated genotypes was immunoprecipitated with H3K4me3- and H3K27me3-specific antibodies. Bars represent qPCR quantification relative to input chromatin. (D) wt (pOG2-luc) or Ap-1 mutated (pOG2-MUT-luc) reporter assay for the Oc promoter fragment in the presence of ATF-4, Fra-2, ATF-4 + Fra-2, and ATF-4–Fra-2 expression vectors (n = 3). (E) ChIP for col1α2 promoter. Arrows indicate primers amplifying fragments at 200 bp. Chromatin of the indicated genotypes was immunoprecipitated with AP-1 antibodies. Endpoint qPCR-amplified fragments are shown. (F) H3K4me3 and H3K27me3 ChIP on col1α2 promoter. Chromatin from osteoblasts of the indicated genotypes was immunoprecipitated with H3K4me3- and H3K27me3-specific antibodies. Bars represent qPCR quantification relative to input chromatin. (G) pH5-luc, pH6-luc, and pH10-luc reporter assay for the col1α2 promoter fragment in the presence of Fra-2, c-Jun, JunB, c-Jun–Fra-2, and JunB–Fra-2 expression vectors (n = 3). Error bars represent SD. *, P < 0.01.
Figure 6.
Figure 6.
Fra-2 affects human matrix protein expression in vivo and in vitro. (A) Immunohistochemistry for Fra-2, collagen1 (col1), and osteocalcin (Oc) in human bone normal tissue, chondrosarcoma, and osteoblastic Os. Arrows indicate Fra-2, col1, or Oc-positive staining for stromal cells in human bone sample. Bar, 100 µm. Inset bar, 50 µm. (B) qPCR analyses of Fra-2 at day 0 of differentiation in Cal72, SAOs, and U2Os human Os cell clones. Area of nodule formation quantification where shRNA control clones represent 100%. n = 3. Alizarin red staining (Cal72, SAOs, and U2Os) and Oil red O (U2Os) staining of control and Fra-2 knockdown human Os cells. Cells were cultured for 15 d on plastic in the presence of β-glycerophosphate and ascorbic acid. (C) qPCR analyses of osteoblast markers Runx2, AP, bone sialoprotein (Bsp), collagen 1α1 (colα1), collagen 1α2 (col1α2), and Oc at day 15 of differentiation. Values are presented as relative expression, and wt is set to 100. (D) Cumulative cell number (proliferation) of U2Os shRNA control and U2Os shRNA Fra-2 clones. Error bars represent mean values ± SD. *, P < 0.01.

References

    1. Bakiri L., Matsuo K., Wisniewska M., Wagner E.F., Yaniv M. 2002. Promoter specificity and biological activity of tethered AP-1 dimers. Mol. Cell. Biol. 22:4952–4964 10.1128/MCB.22.13.4952-4964.2002 - DOI - PMC - PubMed
    1. Behrens A., Haigh J., Mechta-Grigoriou F., Nagy A., Yaniv M., Wagner E.F. 2003. Impaired intervertebral disc formation in the absence of Jun. Development. 130:103–109 10.1242/dev.00186 - DOI - PubMed
    1. Boskey A.L. 1998. Biomineralization: conflicts, challenges, and opportunities. J. Cell. Biochem. Suppl. 72:83–91 10.1002/(SICI)1097-4644(1998)72:30/31+<83::AID-JCB12>3.0.CO;2-F - DOI - PubMed
    1. Bozec A., Bakiri L., Hoebertz A., Eferl R., Schilling A.F., Komnenovic V., Scheuch H., Priemel M., Stewart C.L., Amling M., Wagner E.F. 2008. Osteoclast size is controlled by Fra-2 through LIF/LIF-receptor signalling and hypoxia. Nature. 454:221–225 10.1038/nature07019 - DOI - PubMed
    1. Bruserud O., Tronstad K.J., Berge R. 2005. In vitro culture of human osteosarcoma cell lines: a comparison of functional characteristics for cell lines cultured in medium without and with fetal calf serum. J. Cancer Res. Clin. Oncol. 131:377–384 10.1007/s00432-004-0650-z - DOI - PubMed

Publication types

MeSH terms