Review
. 2010 Oct;11(10):733-9.
doi: 10.1038/nrg2825. Epub 2010 Sep 14.

Tackling the widespread and critical impact of batch effects in high-throughput data

Affiliations
Review

Tackling the widespread and critical impact of batch effects in high-throughput data

Jeffrey T Leek et al. Nat Rev Genet. 2010 Oct.

Abstract

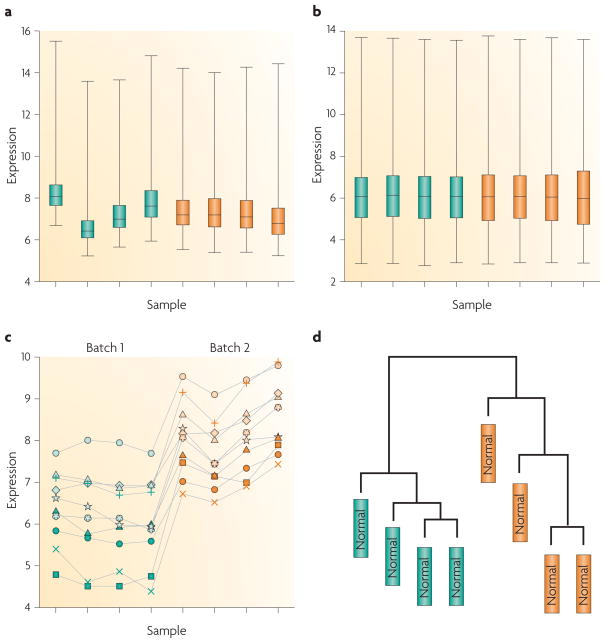
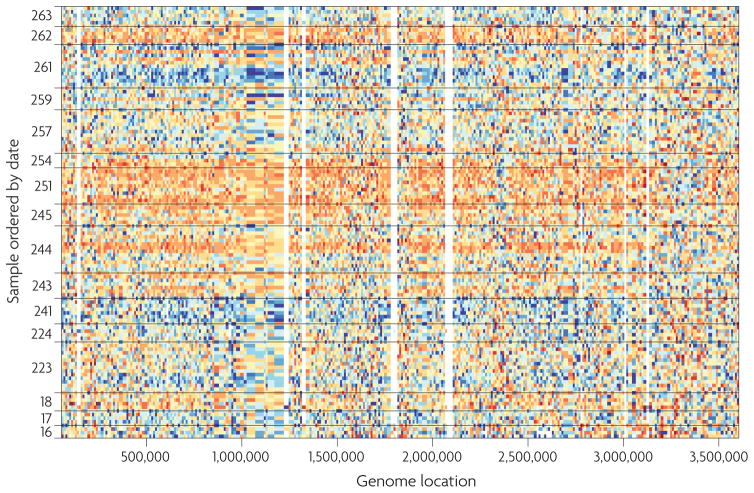
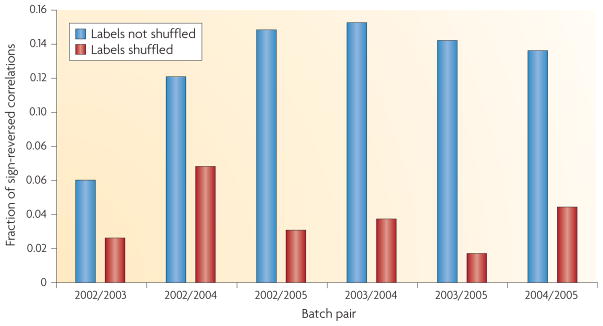
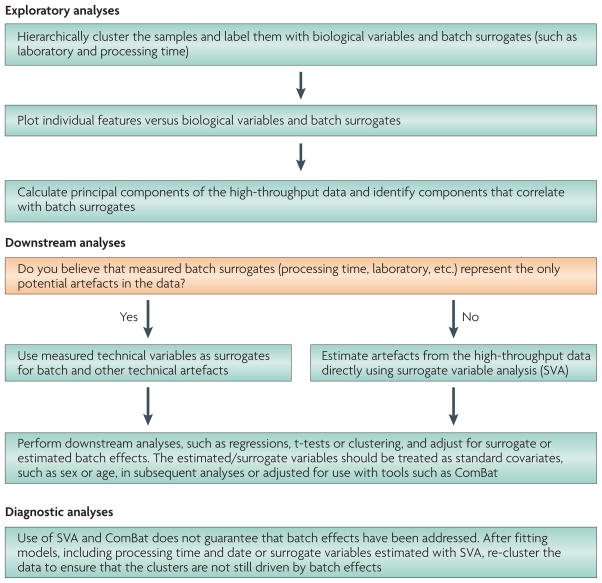
High-throughput technologies are widely used, for example to assay genetic variants, gene and protein expression, and epigenetic modifications. One often overlooked complication with such studies is batch effects, which occur because measurements are affected by laboratory conditions, reagent lots and personnel differences. This becomes a major problem when batch effects are correlated with an outcome of interest and lead to incorrect conclusions. Using both published studies and our own analyses, we argue that batch effects (as well as other technical and biological artefacts) are widespread and critical to address. We review experimental and computational approaches for doing so.


Conflict of interest statement

Competing interests statement

The authors declare no competing financial interests.

Figures

Figure 1
Figure 1. Demonstration of normalization and surviving batch effects
For a published bladder cancer microarray data set obtained using an Affymetrix platform, we obtained the raw data for only the normal samples. Here, green and orange represent two different processing dates, a | Box plot of raw gene expression data (log base 2). b | Box plot of data processed with RMA, a widely used preprocessing algorithm for Affymetrix data. RMA applies quantile normalization — a technique that forces the distribution of the raw signal intensities from the microarray data to be the same in all samples. c | Example often genes that are susceptible to batch effects even after normalization. Hundreds of genes show similar behaviour but, for clarity, are not shown. d | Clustering of samples after normalization. Note that the samples perfectly cluster by processing date.
Figure 2
Figure 2. Batch effects for second-generation sequencing data from the 1000 Genomes Project
Each row is a different HapMap sample processed in the same facility with the same platform. See Supplementary information SI (box) for a description of the data represented here. The samples are ordered by processing date with horizontal lines dividing the different dates. We show a 3.5 Mb region from chromosome 16. Coverage data from each feature were standardized across samples: blue represents three standard deviations below average and orange represents three standard deviations above average. Various batch effects can be observed, and the largest one occurs between days 243 and 251 (the large orange horizontalstreak).
Figure 3
Figure 3. Batch effects also change the correlations between genes
We normalized every gene in the second gene expression data set in TABLE 1 to mean 0, variance 1 within each batch. (The 2006 batch was omitted owing to small sample size.) We identified all significant correlations (p < 0.05) between pairs of genes within each batch using a linear model. We looked at genes that showed a significant correlation in two batches and counted the fraction of times that the correlation changed between the two batches. A large percentage of significant correlations reversed signs across batches, suggesting that the correlation structure between genes changes substantially across batches. To confirm this phenomenon is due to batch, we repeated the process—looking for significant correlations that changed sign across batches—but with the batch labels randomly permuted. With random batches, a much smaller fraction of significant correlations change signs. This suggests that correlation patterns differ by batch, which would affect rank-based prediction methods as well as system biology approaches that rely on between-gene correlation to estimate pathways.
Figure 4
Figure 4. Key steps in the statistical analysis of batch effects
The first step is exploratory data analysis to identify and quantify potential batch effects and other artefacts. The second step is to use known or estimated surrogates of the artefacts to adjust downstream analyses. The final step is to carry out diagnostic analyses.

References

    1. Youden WJ. Enduring values. Technometrics. 1972;14:1–11.
    1. Spielman RS, et al. Common genetic variants account for differences in gene expression among ethnic groups. Nature Genet. 2007;39:226–231. - PMC - PubMed
    1. Petricoin EF, et al. Use of proteomic patterns in serum to identify ovarian cancer. Lancet. 2002;359:572–577. - PubMed
    1. Akey JM, Biswas S, Leek JT, Storey JD. On the design and analysis of gene expression studies in human populations. Nature Genet. 2007;39:807–808. author reply 808–809. - PubMed
    1. Baggerly KA, Edmonson SR, Morris JS, Coombes KR. High-resolution serum proteomic patterns for ovarian cancer detection. Endocr Relat Cancer. 2004;11:583–584. author reply 585–587. - PubMed

Publication types

MeSH terms